Creating a Line and Scatter Graph custom question
The Line and Scatter Graph custom question type lets you create, configure, and plot data on line and scatter graphs.
This article explains how to create a Line and Scatter Graph in Surpass.
In this article
1. Choose your item type
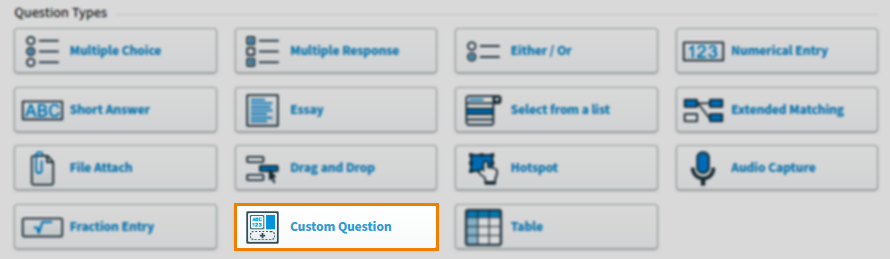
In your subject, select Create New Item to open the Question Types menu. Choose Custom Question to create a blank Custom Question item and go to the Edit screen.
2. Name your item
Enter the item’s name in the Name field.

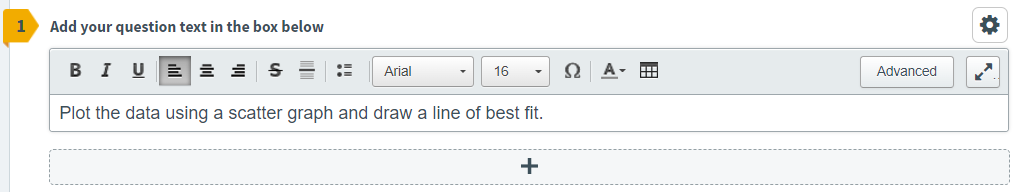
3. Enter your question text
Enter your question text in the question stem. Select Add text Area to add an additional question stem. You can have a maximum of five question stems per item.
Open Additional Options to add source material or assistive media to your question stem.
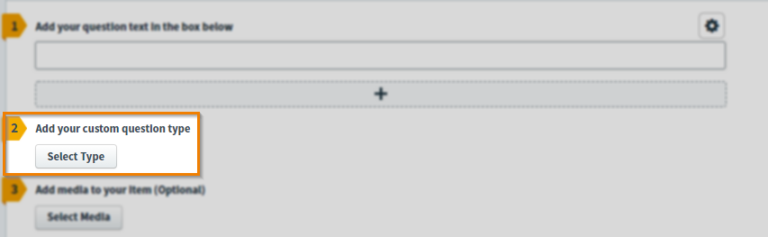
4. Add your custom question type
Select Select Type to open the Select Type dialog.
Select the ZIP file you want to add to your item.
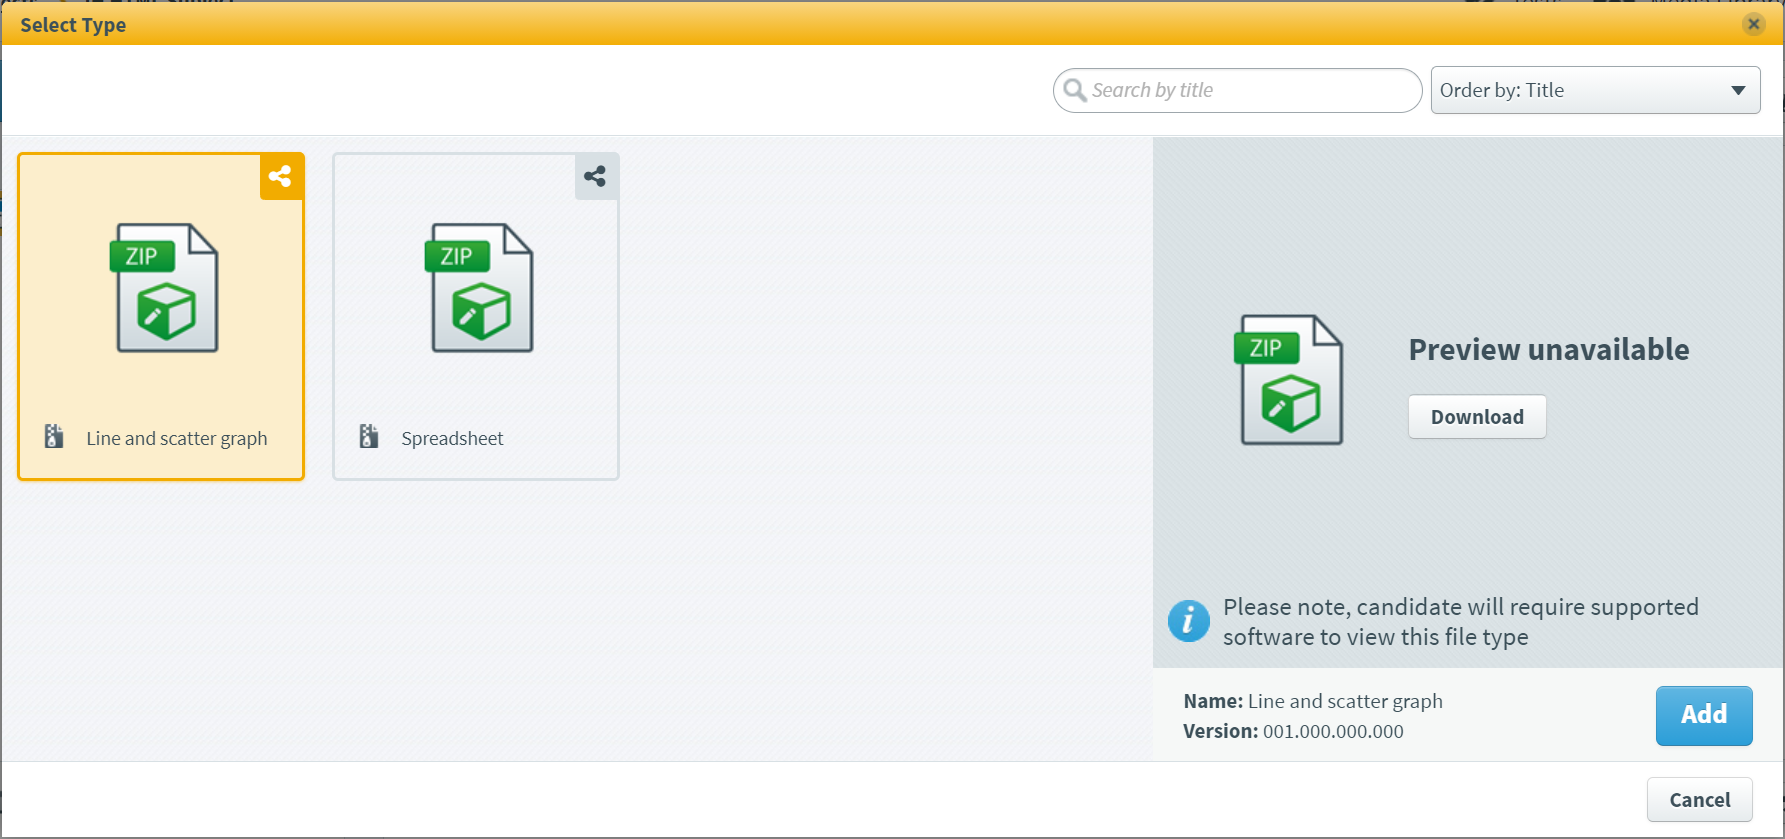
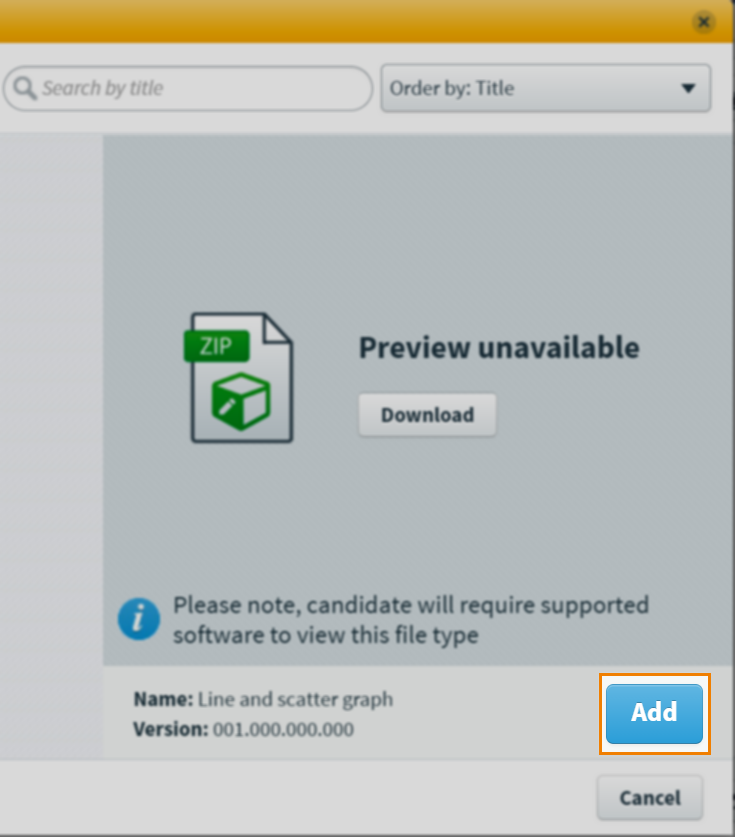
Select Add to add your Custom Question type to the item.
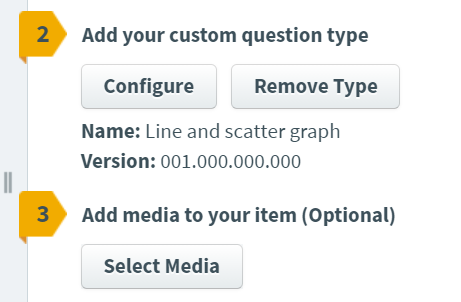
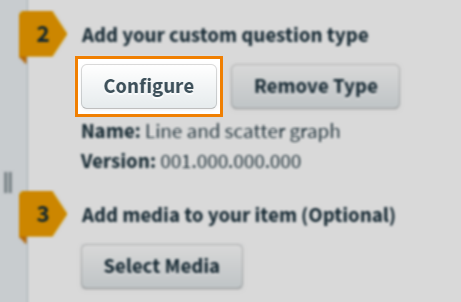
Once added, the name and version number of the Custom Question type are detailed in the item.
Uploading custom question ZIP files to the Media Library
Custom Question type ZIP files must be uploaded to the Media Library.
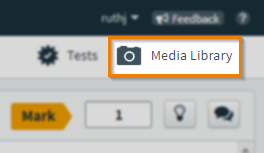
Go to Item Authoring and select your subject.
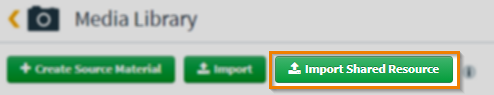
Select Media Library .
Select Import Shared Resource .
In your device’s file explorer, choose the file and select Open.
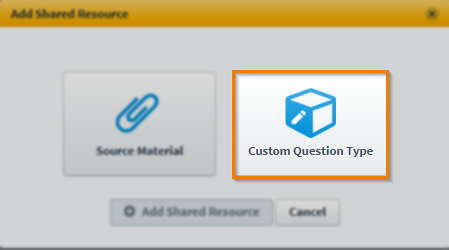
In the Add Shared Resource dialog, select Custom Question Type.
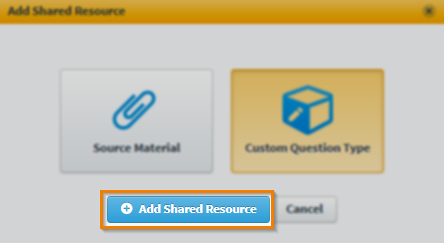
Select Add Shared Resource .
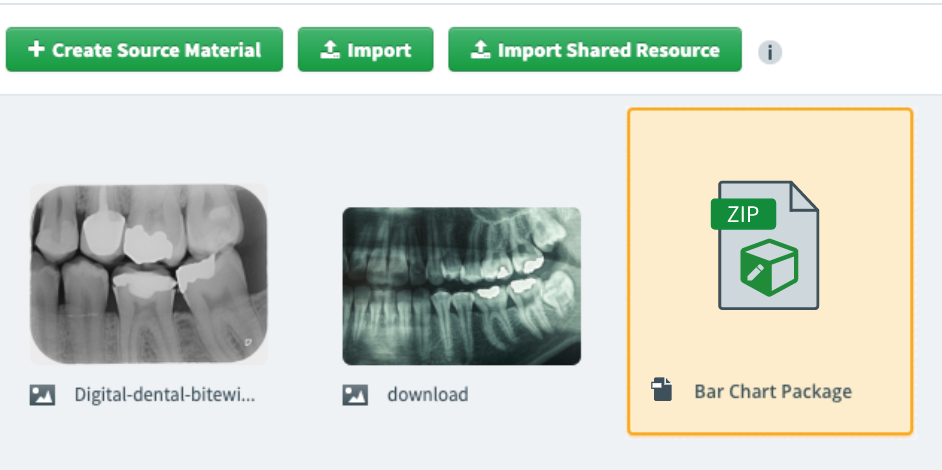
The ZIP file is now in your subject’s Media Library.
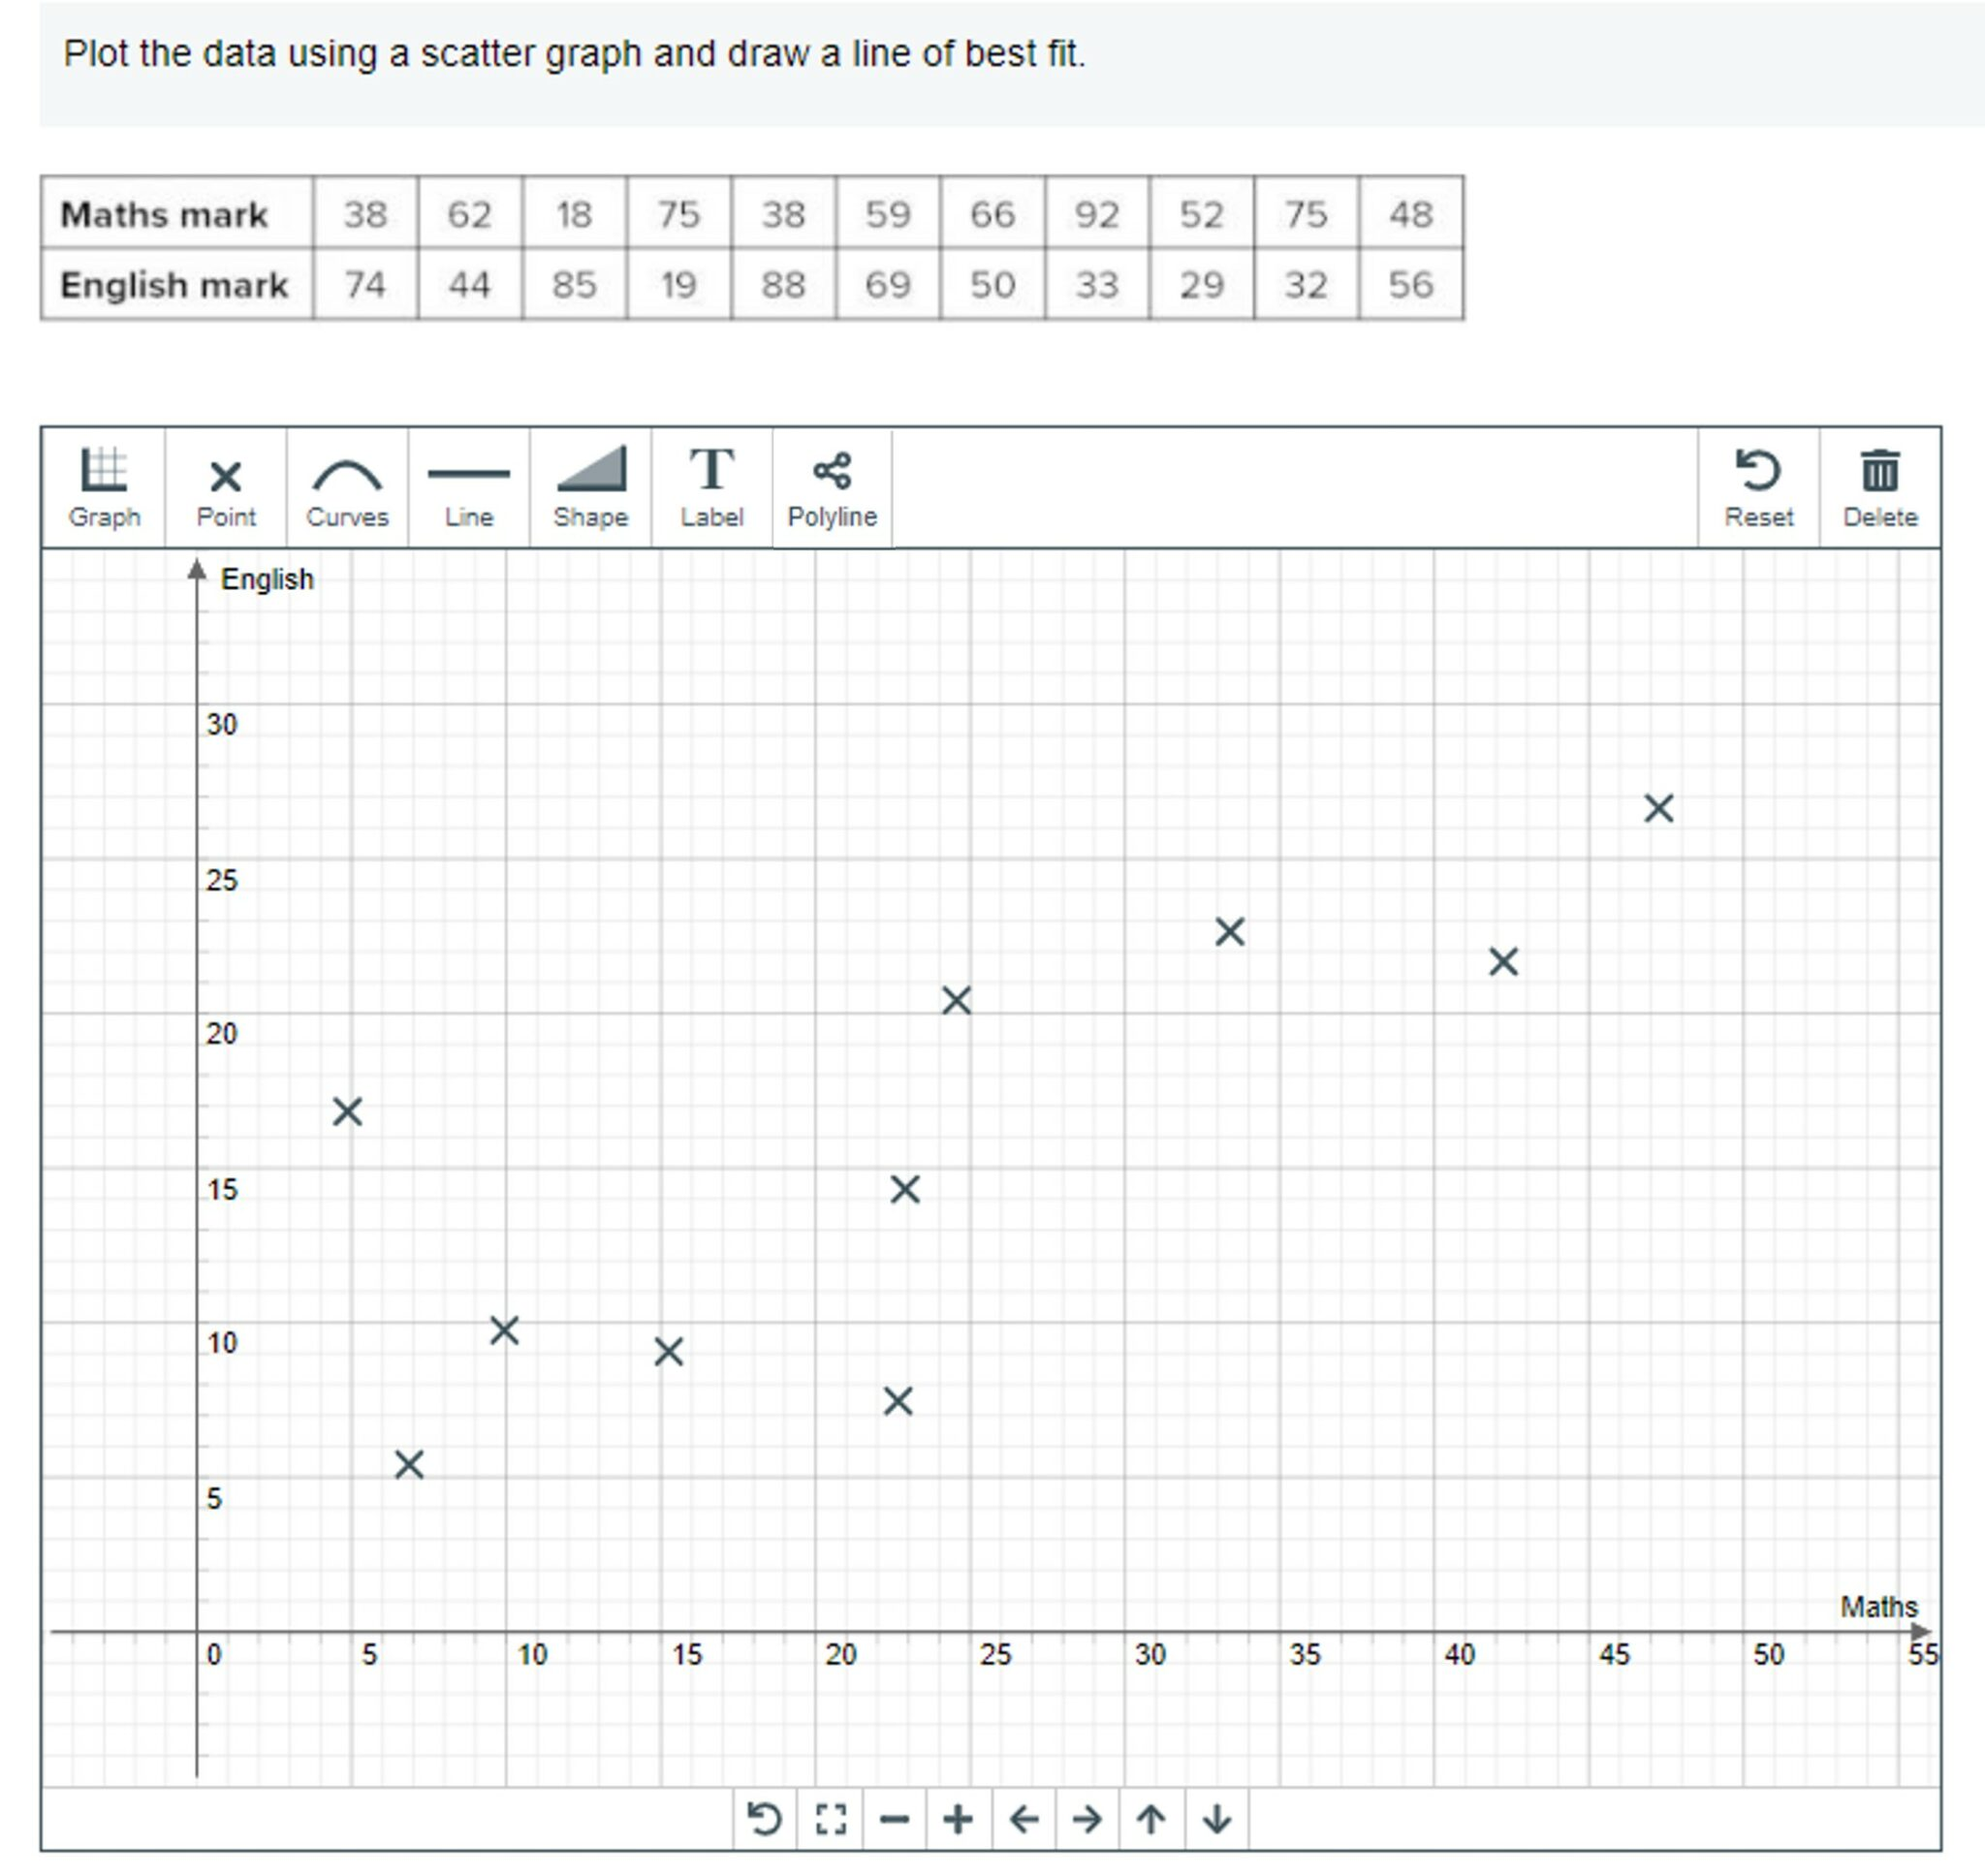
5. Configure your Line and Scatter Graph custom question
Select Configure to open the custom ZIP file. This allows you to change how the item displays in delivery.
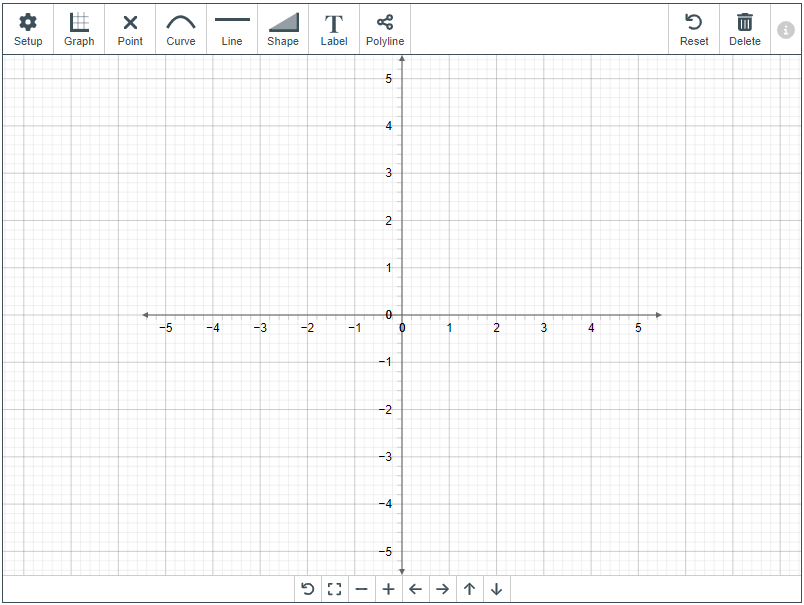
The Line and Scatter Graph dialog contains the following features:
- Setup user interface and Graph settings tabs.
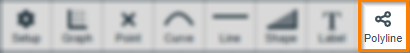
- Point, Curve, Line, Shape, Label and Polyline tools.
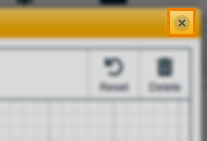
- Reset and Delete buttons.
- Navigation controls.
Setup user interface
Select Setup to open the Setup user interface tab.
You can configure which settings and tools candidates have access to using the Show to candidate checkboxes.
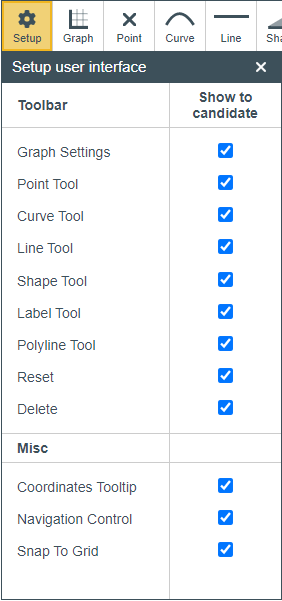
Refer to the following table for information on the different settings in the Setup user interface tab.
| Setting | Description |
|---|---|
| Graph Settings |
Enables candidates to configure settings in the Graph settings tab. |
| Point Tool |
Enables candidates to use the Point tool. |
| Curve Tool |
Enables candidates to use the Curves tool. |
| Line Tool |
Enables candidates to use the Line tool. |
| Shape Tool |
Enables candidates to use the Shape tool. |
| Label Tool |
Enables candidates to use the Label tool. |
| Reset |
Enables candidates to use the Reset button.
NOTE: Candidates can only reset their own configurations, not those made in item authoring.
|
| Delete |
Enables candidates to use the Delete button. |
| Coordinates Tooltip |
Enables candidates to see the coordinates of plotted points by moving their cursor over them. |
| Navigation Controls |
Enables candidates to use the navigation controls. |
| Snap To Grid |
Automatically places candidate’s selected points on the nearest grid point. |
Graph settings
Select Graph to open the Graph settings tab.

You can configure your graph’s grid and axes settings or label your graph in the Graph settings tab.
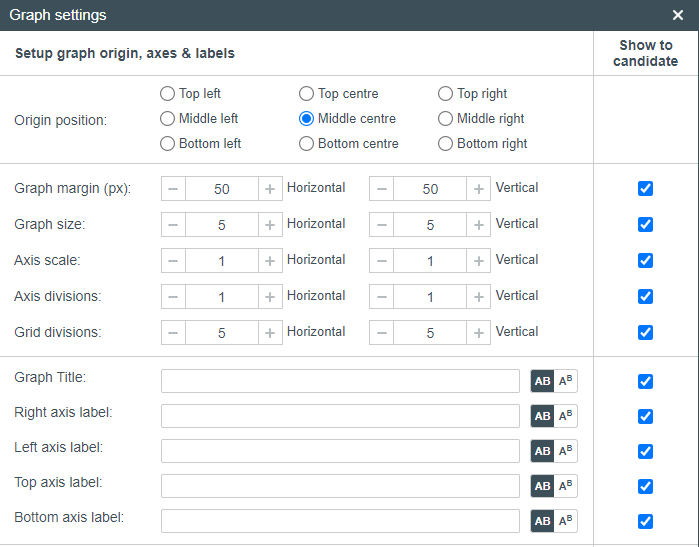
Refer to the following table for information on the different settings in the Graph settings tab.
| Setting | Description |
|---|---|
| Origin position |
Determines where the centre of the graph is positioned.
NOTE: Candidates can navigate away from the origin position if you have given them access to the navigation controls in the Graph settings tab.
|
| Graph margin (px) |
Determines the size of the margin between the axis and the edge of the grid when the origin position is not set to middle centre. |
| Graph size | Determines the length of the axis on the grid. |
| Axis scale |
Determines what multiple the intervals along axis increases by.
|
| Axis divisions | Determines the distance between the intervals along the axis. |
| Grid divisions | Defines how many grid divisions there are in major grid squares. |
| Graph Title | The title of the graph. |
| Right axis label | The label for the right axis. |
| Left axis label | The label for the left axis. |
| Top axis label | The label for the top axis. |
| Bottom axis label | The label for the bottom axis. |
| Superscript/Subscript | Enables candidates to change selected text into superscript or subscript. |
| Show to candidate | Enables candidates to configure the selected setting. |
Point tool
Select Point to open the Point tool.

Select grid to plot points.
You can click and drag the points to reposition them.
Curves tool
Select Curve to open the Curve tool.

Select four locations on the grid to plot a curve.
Click and drag the circular points to change the length of the curve.
Click and drag the square points to manipulate the curve.
Line Tool
Select Line to open the Line tool.

Select two locations on the grid to plot a line.
Click and drag either of the points or the line itself to reposition the line.
Shape Tool
Select Shape to open the Shape tool.

Select multiple locations on the grid and then select the first point you added to plot a shape.
Click and drag the points of the shape to reposition them or click the centre of the shape and drag it to reposition the shape.
Label Tool
Select Label to open the Label tool.

Select the grid to place your label and enter your label text in the field.
Highlight your text and select the appropriate button to change the text to superscript or subscript. The preview section shows how the label looks on the graph.
Click and drag the label to reposition it.
Select a point to anchor the label to the point.
Polyline tool
Select Polyline to open the Polyline tool.
Select numerous points to plot a polyline.
Click and drag the points of the polyline to reposition them or click the centre of a line and drag to reposition the shape.
Reset graph
Select Reset to reset the grid to its blank state. This action clears all plotted data and settings you have configured.
Delete data
Select Delete and select plotted data on the grid to delete the selected data.
Navigation controls
Navigate the grid using the navigation controls.
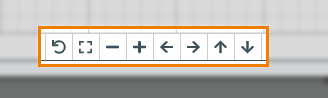
Refer to the following table for information on the different navigation controls.
| Setting | Icon | Description |
|---|---|---|
| Reset View |  |
Resets the view of the grid to the settings configured in the Graph tab. |
| Show all |
|
Fits the view of the grid to put the plotted data in the centre. |
| Zoom out |
|
Zooms out of the grid. |
| Zoom in |
|
Zooms in on the grid. |
| Pan left |
|
Navigates to the left of the grid. |
| Pan right |  |
Enables candidates to configure the selected setting. |
| Pan up |
|
Navigates to the right of the grid. |
| Pan down |
|
Navigates down the grid. |


6. Save your configuration
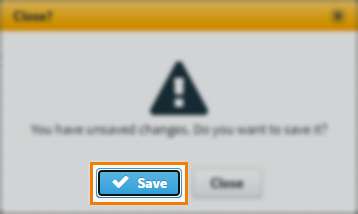
To save your configurations, select Close .
Select Save .
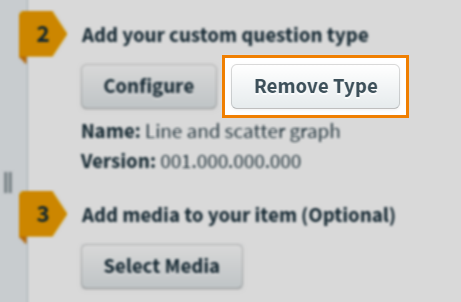
Removing custom question types
Once uploaded, Custom Question types can be removed from your item.
Select Remove Type to remove a Custom Question type.
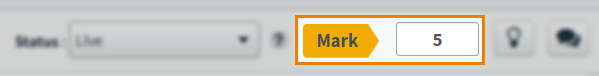
7. Set the question’s marks
Set the item’s total marks in the Mark field.
8. Select a workflow status
Set the item’s workflow status in the Status drop-down menu. Only items set to Live can be used in a test.
9. Saving and closing your item
Select Save to save your item to your subject.
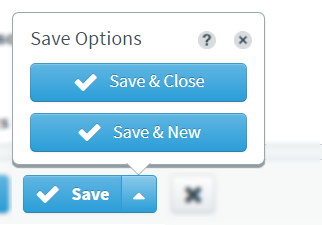
To see additional saving options, use the Save arrow to open the Save Options menu. Select Save & Close to save the item and return to the Subjects screen. Select Save & New to save the item and create another Custom Question item.
Select Close to leave the Edit screen. If you have unsaved changes, you are prompted to either save or discard them.
Further reading
For information on the other available Custom Question Types, read the following articles: