Creating a Graph Selector custom question
The Graph Selector custom question type lets you present candidates with a choice of three graphs to create when answering the question. Candidates can choose between a bar chart, line graph, and pie chart.
This article explains how to create a Graph Selector question in Surpass.
In this article
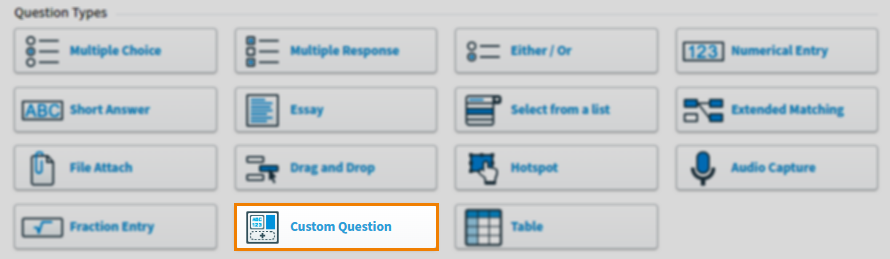
1. Choose your item type
In your subject, select Create New Item to open the Question Types menu. Choose Custom Question to create a blank Custom Question item and go to the Edit screen.
2. Name your item
Enter the item’s name in the Name field.

3. Enter your question text
Enter your question text in the question stem. Select Add text Area to add an additional question stem. You can have a maximum of five question stems per item.
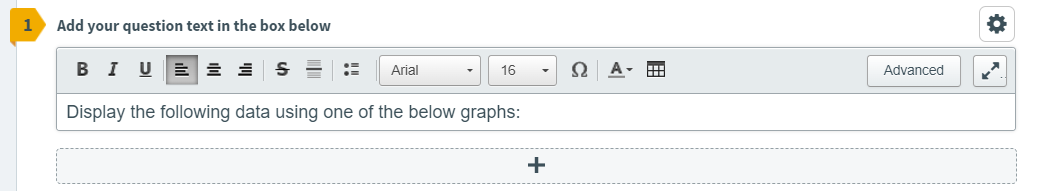
Open Additional Options to add source material or assistive media to your question stem.
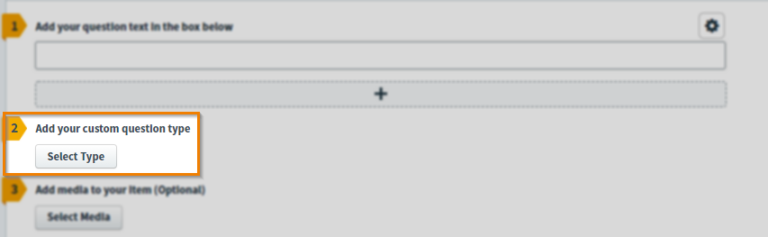
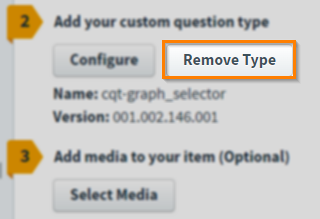
4. Add your custom question type
Select Select Type to open the Select Type dialog.
Select the ZIP file you want to add to your item.
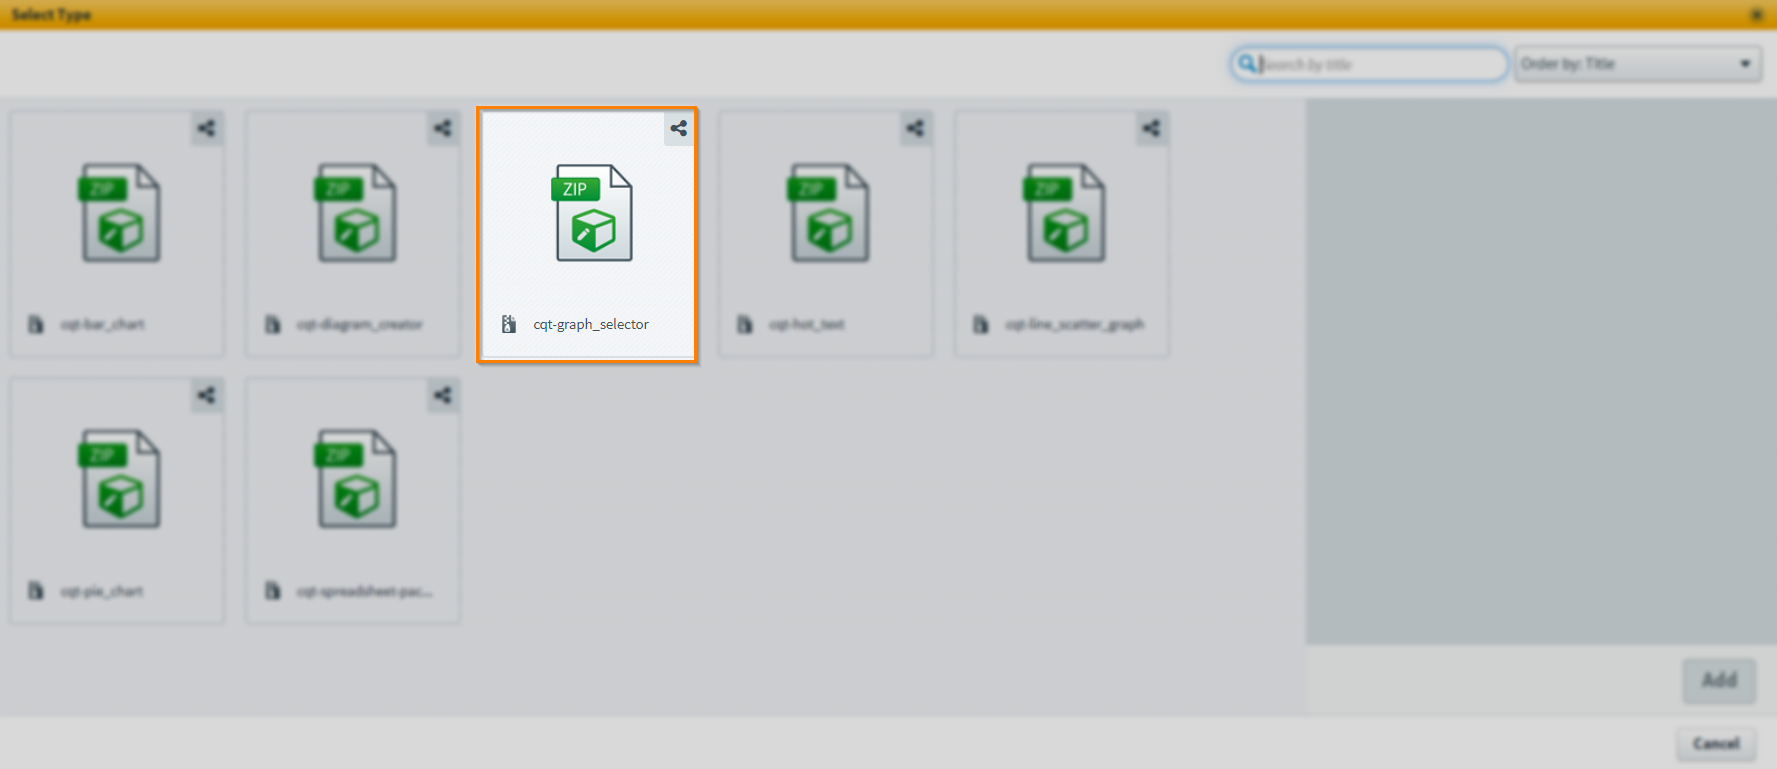
Select Add to add your Custom Question type to the item.
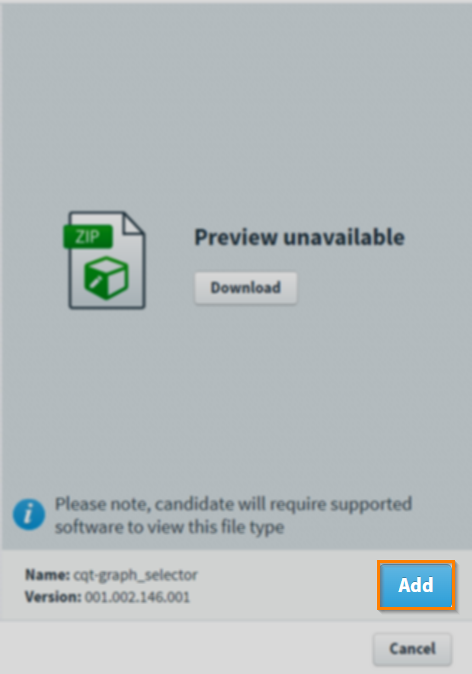
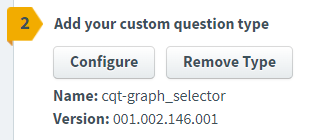
Once added, the name and version number of the Custom Question type are detailed in the item.
Uploading custom question ZIP files to the Media Library
Custom Question type ZIP files must be uploaded to the Media Library.
Go to Item Authoring and select your subject.
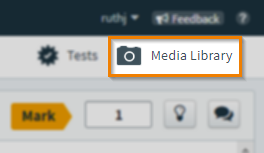
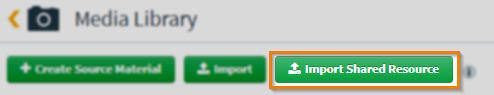
Select Media Library .
Select Import Shared Resource .
In your device’s file explorer, choose the file and select Open.
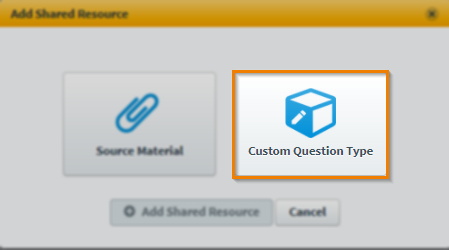
In the Add Shared Resource dialog, select Custom Question Type.
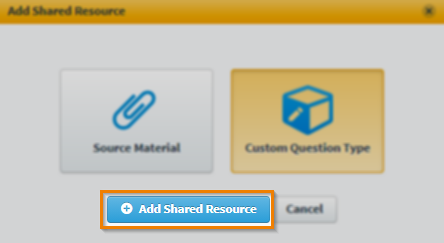
Select Add Shared Resource .
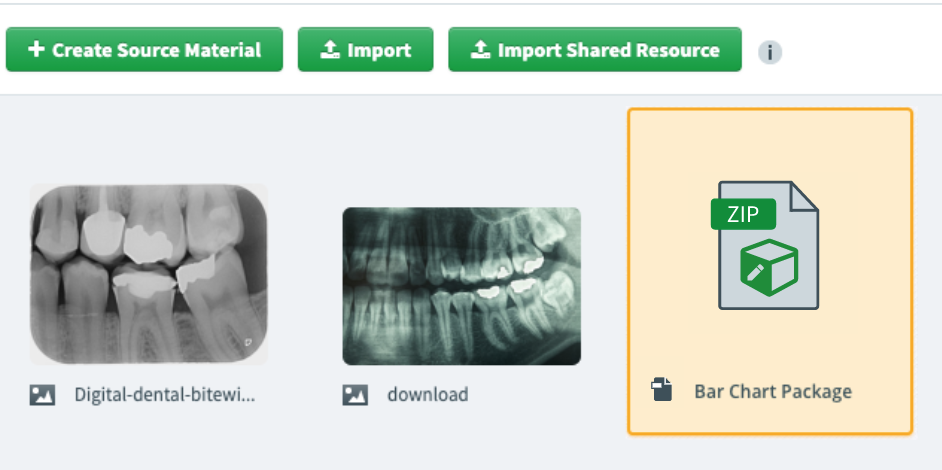
The ZIP file is now in your subject’s Media Library.
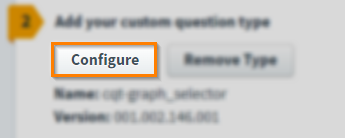
5. Configure your Graph Selector custom question
Select Configure to open the custom ZIP file. This allows you to change how the item displays in delivery.
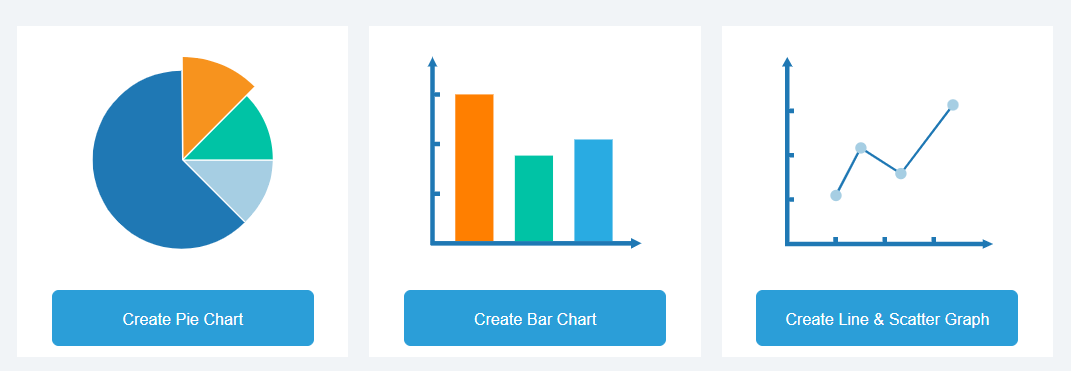
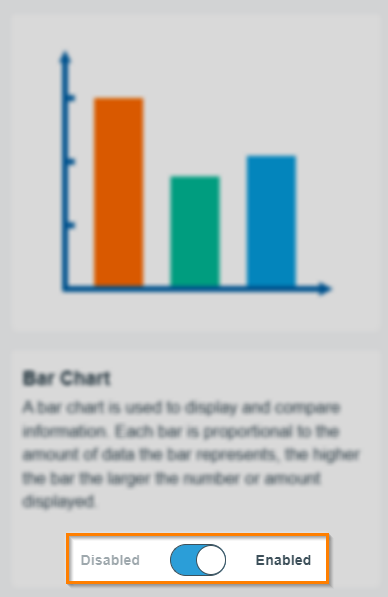
The Graph Selector has three toggle buttons that, when enabled, allow candidates to create the following graphs:
- Pie Chart
- Bar Chart
- Line and Scatter Graph
You can disable a graph/chart if you do not wish candidates to use that option when answering the question.
Working in the Graph Selector as a candidate
Candidates are presented with up to a maximum of three graphs to use when answering the question.
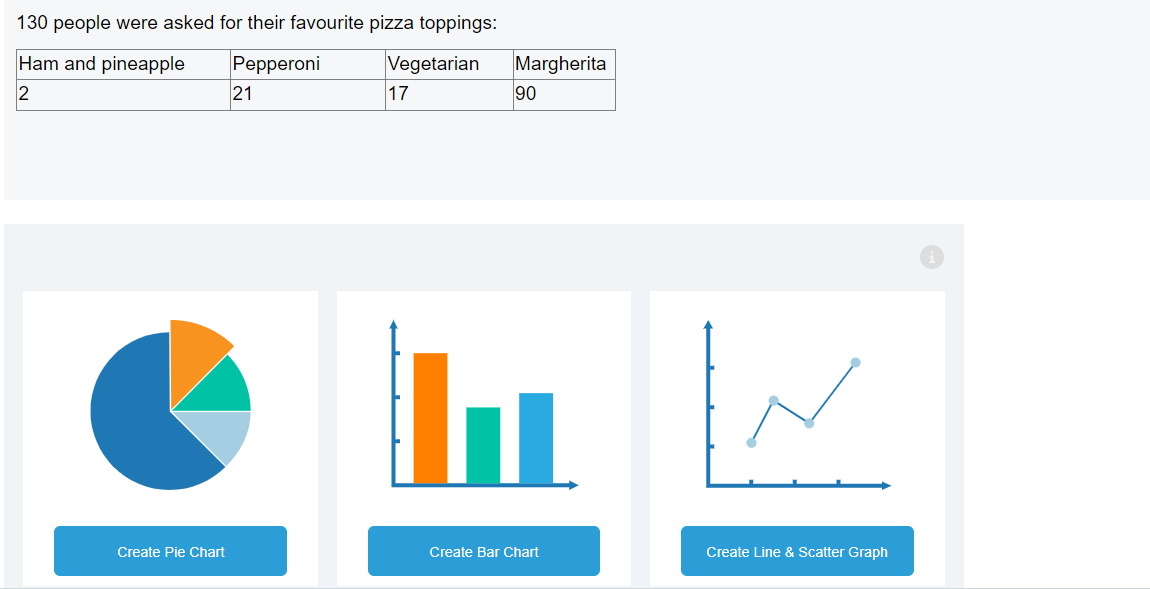
Candidates can create and configure their selected graph type using the same editing interfaces as item authors, except for some settings which only item authors have access to.
For more information on how to configure each graph type, read the configuring a line and scatter graph, bar chart, and pie chart sections of this article.
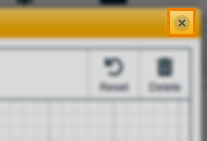
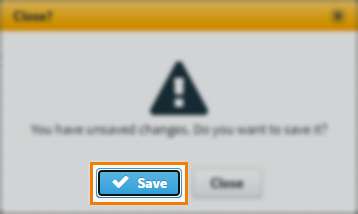
6. Save your configuration
To save your configurations, select Close .
Select Save .
Removing custom question types
Once uploaded, Custom Question types can be removed from your item.
Select Remove Type to remove a Custom Question type.
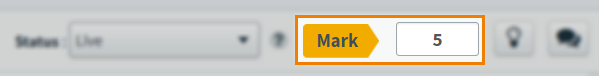
7. Set the question’s marks
Set the item’s total marks in the Mark field.
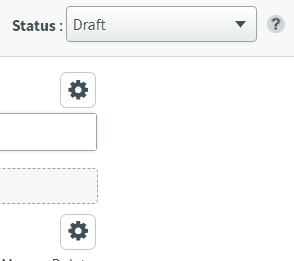
8. Select a workflow status
Set the item’s workflow status in the Status drop-down menu. Only items set to Live can be used in a test.
9. Saving and closing your item
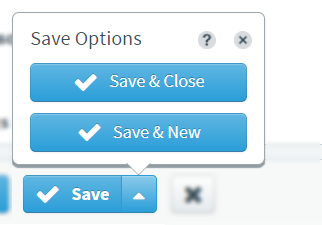
Select Save to save your item to your subject.

To see additional saving options, use the Save arrow to open the Save Options menu. Select Save & Close to save the item and return to the Subjects screen. Select Save & New to save the item and create another Custom Question item.
Select Close to leave the Edit screen. If you have unsaved changes, you are prompted to either save or discard them.

Further reading
For information on the other available Custom Question Types, read the following articles: