Viewing Item Bank reports
The Item Bank report in Reporting (item production report) displays information about all items in your subject. This includes details like items’ workflow statuses, P value, and usage count.
This article explains how to navigate and interpret an Item Bank report, including information on filtering, exporting to CSV, and the Details, Content, Tags, and Relationships panels.
In this article
Navigating to an Item Bank report
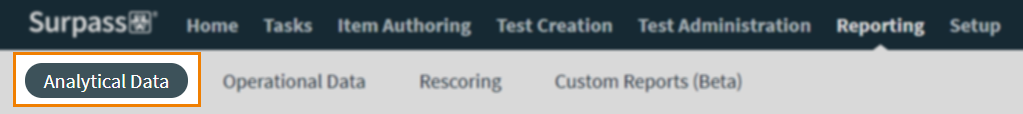
To view an Item Bank report, go to Reporting > Analytical Data.
Choose a subject in the Analytical Data screen and select the number in the Item Bank column to view the Item Bank report.

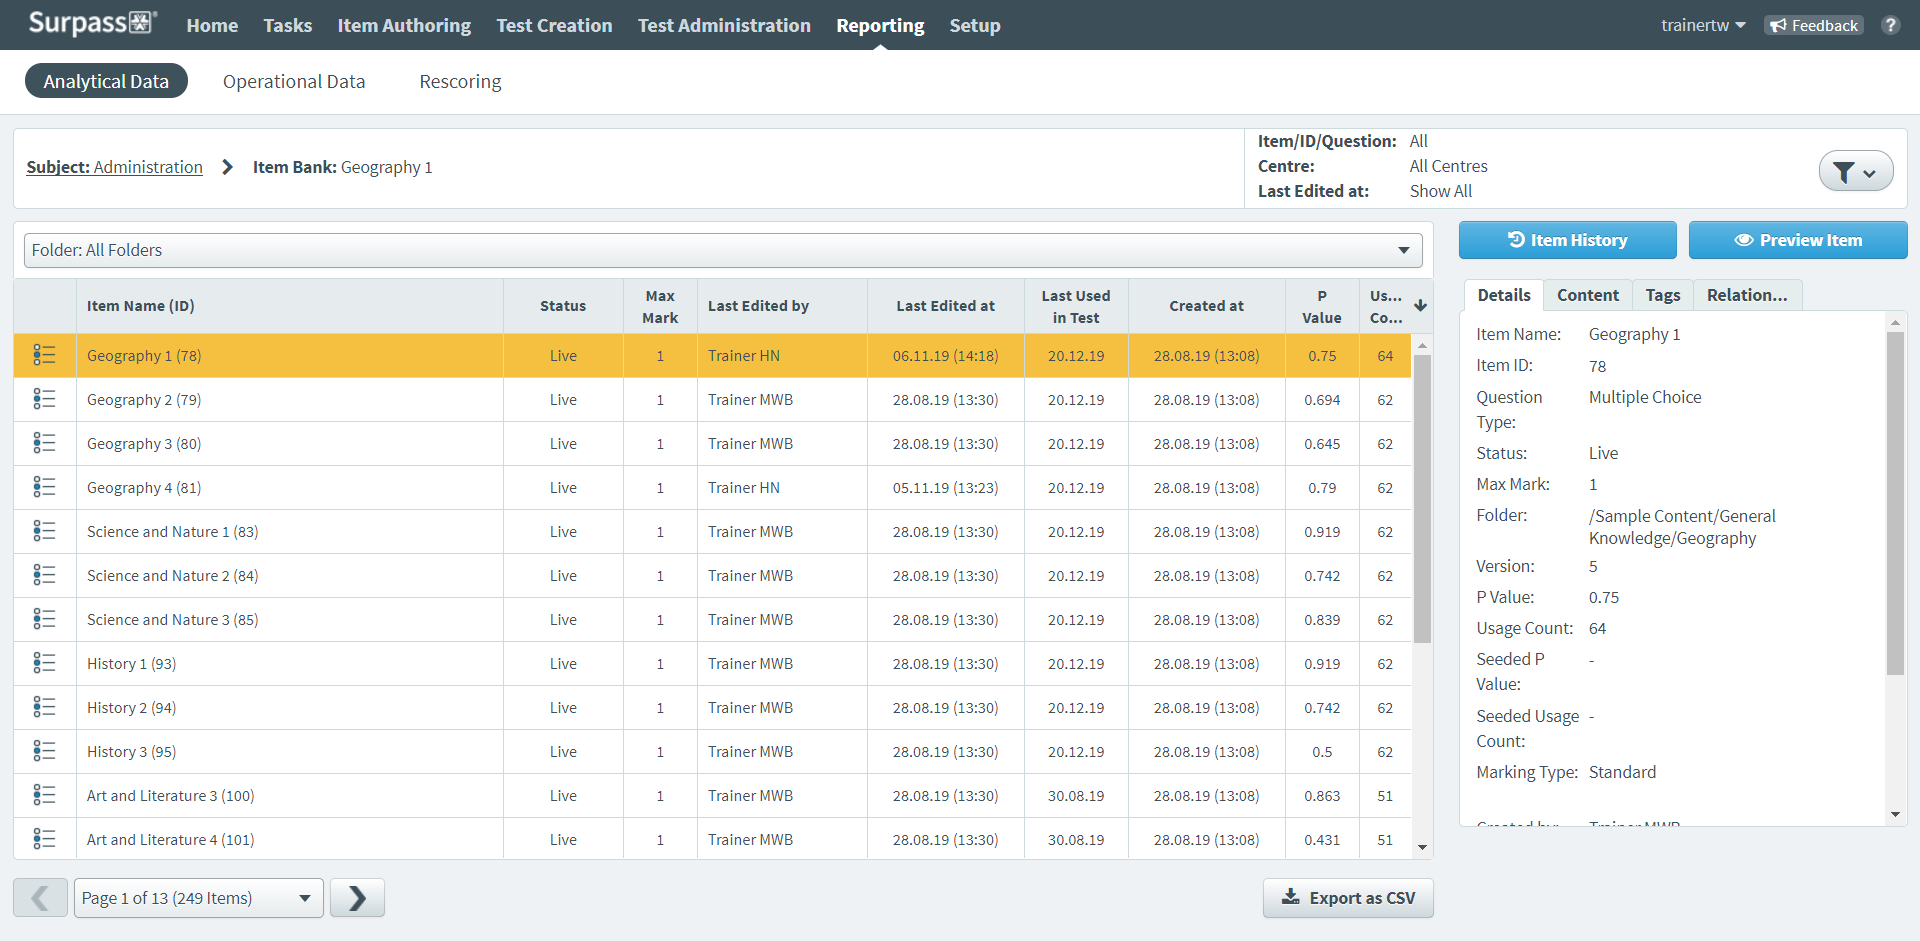
About the Item Bank report table
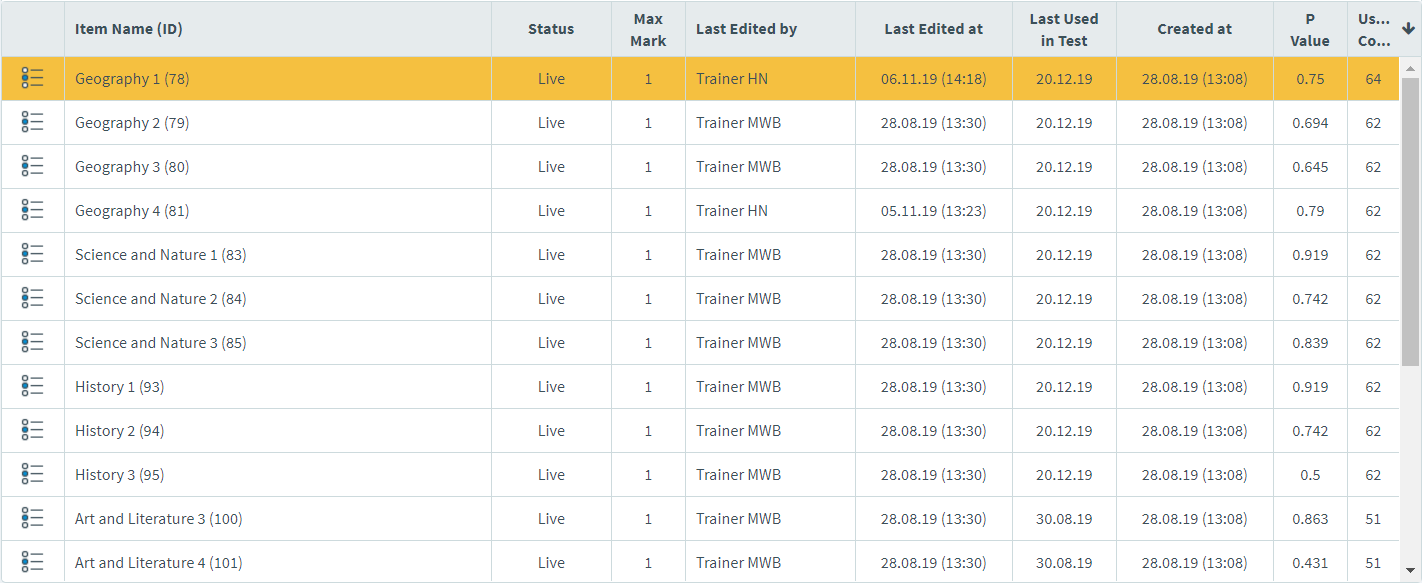
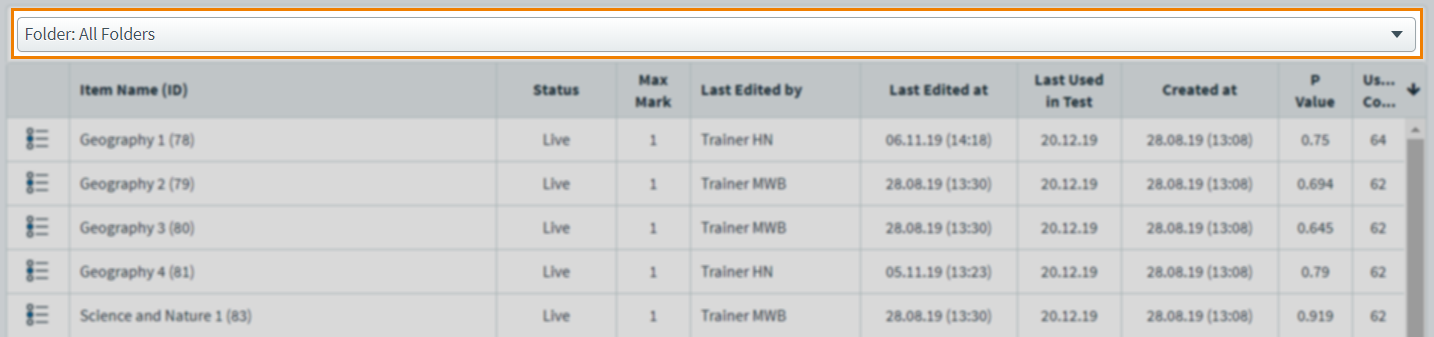
The Item Bank report grid lists all items in your chosen subject, whether they have been added to a test form or not. Each row is dedicated to a single item. Refer to the following table for information on each column.
| Column | Description |
|---|---|
| Item Name (ID) | Displays the item’s name. The item’s unique ID code is displayed in brackets. |
| Status |
Displays the item’s workflow status. |
| Max Mark | Displays the item’s maximum available mark. |
| Last Edited By | Displays the user name of the person who last edited the item. |
| Last Edited At | Displays the date and time at which the item was last edited. |
| Last Used in Test | Displays the date on which the item was last used in a test. |
| Created At | Displays the date on which the item was created. |
| P Value |
Displays the item’s probability value. A P value is a statistical representation of item difficulty calculated by dividing the number of times an item has been answered correctly by the number of times the item has been attempted. P values are represented as a decimal number between 0 and 1. The closer the P value is to 1, the easier the item is considered to be. If an item is answered correctly nine times out of ten, it will have a P value of 0.9. This could be considered an easy item. If an item is answered correctly five times out of ten, it will have a P value of 0.5. This could be considered a medium item. If an item is answered correctly two times out of ten, it will have a P value of 0.2. This could be considered a hard item. |
| Usage Count | Indicates how many times the item has been delivered to candidates. |
Viewing an item’s history
To view a detailed log of an item’s history in Surpass, including additions, removals, and workflow status changes, choose it in the table and select Item History . For more information, read Using the item history.
Previewing an item
To see an item from a candidate’s perspective in the test driver, choose it in the table and select Preview Item .
About the Details panel
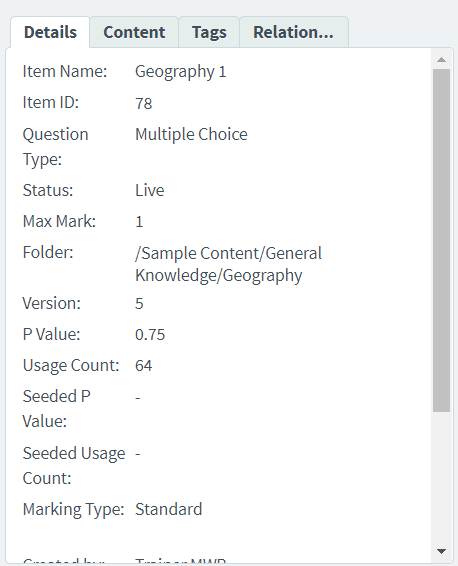
The Details panel displays Item Bank report information for the selected item along with the following additional details:
| Information | Description |
|---|---|
| Folder | Displays the folder structure of the item’s location in the subject. |
| Version | DIsplays the item’s version number. |
| Seeded P Value |
Displays the item’s original P value before being migrated into Surpass.
NOTE: This is only available for items imported to Surpass from other systems using the API.
|
| Seeded Usage Count |
Displays the item’s original usage count before being migrated into Surpass.
NOTE: This is only available for items imported to Surpass from other systems using the API.
|
| Marking Type | Indicates whether the item uses Standard, Weighted, Combination, or Human marking. |
| Created by | Displays the user who created the item. |
About the Content panel
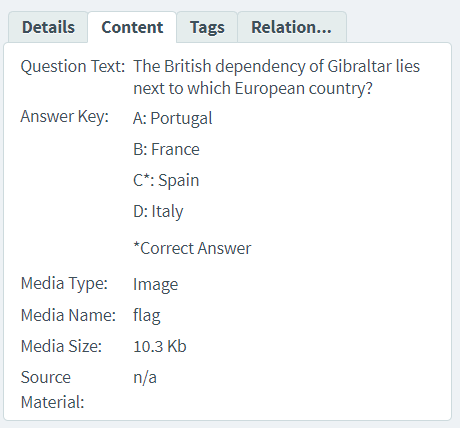
The Content panel displays the chosen item’s question type, the question text, and a key indicating the correct answer. Also included are details about any media files or source material attached to the item.
About the Tags panel
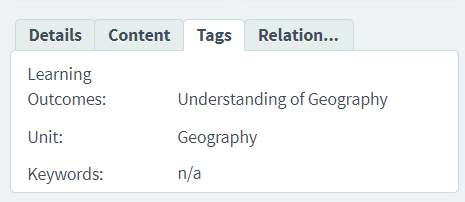
The Tags panel displays the chosen item’s associated tag values. This includes the default tag groups (Learning Outcomes, Unit, and Keywords) and any applicable custom tag groups.
About the Relationships panel
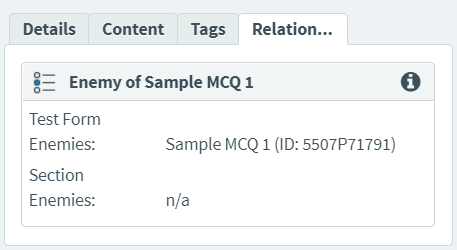
The Relationships panel displays the chosen item’s enemy relationships (both on the test form and section level) and, if the item is in an item set, its friend relationships.
For more information, read Adding enemies to an item and About item sets.
Filtering the Item Bank report table

By default, the Item Bank report displays all data from items edited in the last 30 days. To change the data range, select Filter .
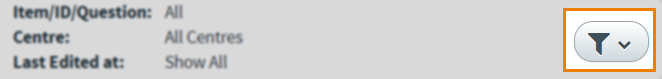
To learn more about the available filters, refer to the following table.
| Filter | Description |
|---|---|
| Last Edited At | Determines the date range for the Item Bank report. Choose whether the grid displays data for items edited in the Last 7 Days, Last 30 Days (default), Last 180 Days, or a Custom Date Range. |
| Status | Determines whether only items at a certain workflow status are displayed in the Item Bank grid. Select Show All to display items at all workflow status. |
| Item Name, ID, or Question Text | Displays only specific items based on their name, ID, or question text. |
You can also select a folder in the Folder menu to show only items in that folder in the Item Bank report.
123P456|FR'.
Item language variants are not available by default. If you would like item language variants enabled on your Surpass instance, contact your Surpass Customer Success Manager.
Exporting an Item Bank report as CSV
To export Item Bank report data to a spreadsheet, select Export as CSV .
Further reading
To learn more about Reporting, read the following articles: