About the Operational Data screen
The Operational Data screen in Reporting displays statistical information about test volumes on a centre and subject basis.
This article explains how to navigate and interpret the Operational Data screen and includes information on how to export report information as a CSV.
In this article
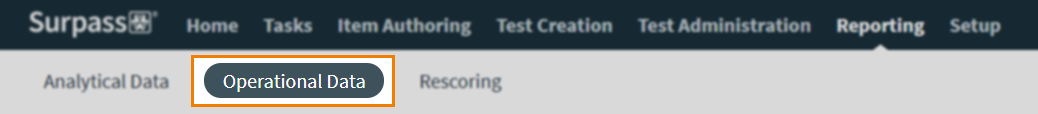
Navigating to the Operational Data screen
To view the Operational Data screen, go to Reporting > Operational Data.
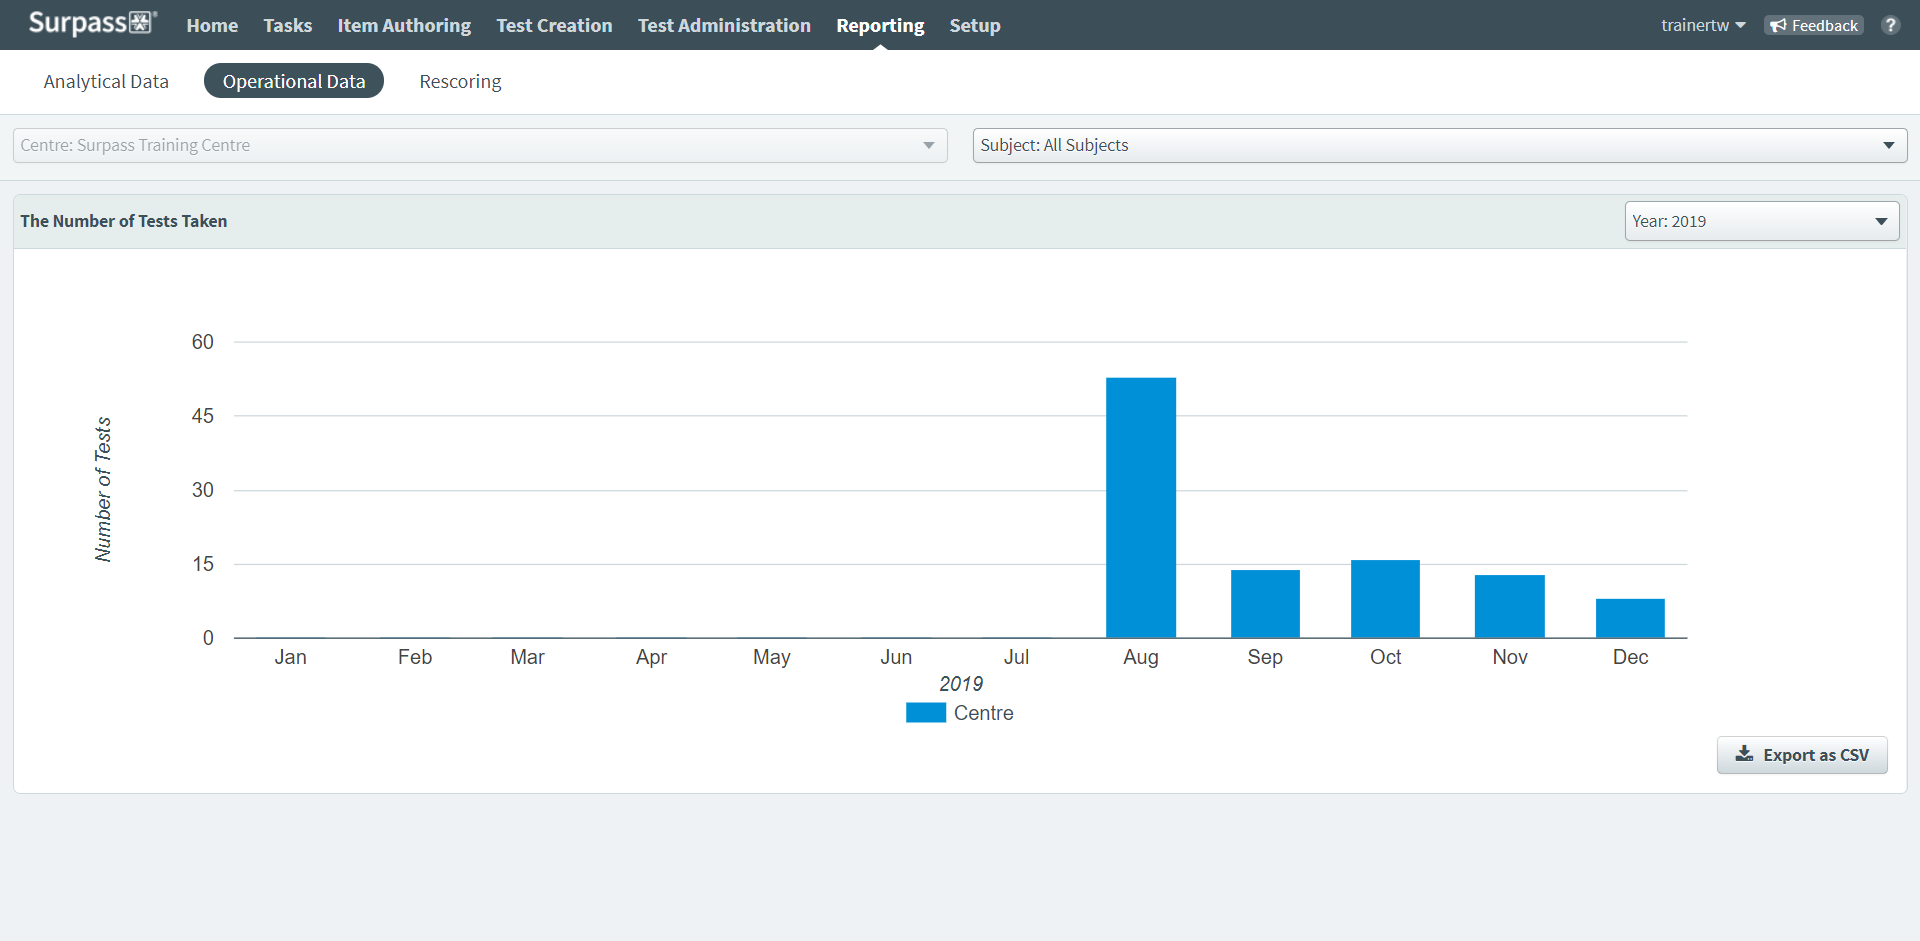
About the Operational Data chart
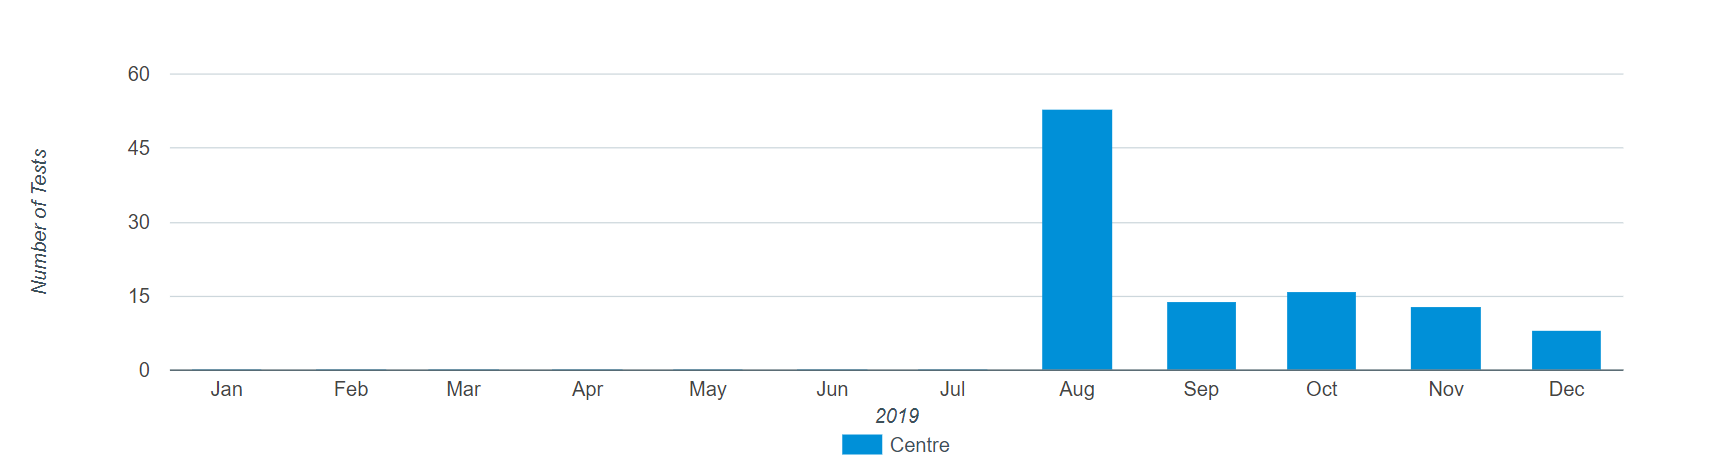
The Operational Data chart displays a month-by-month breakdown of tests delivery volumes.
By default, the Operational Data chart displays information from all centres and subjects. To only view data from a specific centre or subject, select the relevant centre or subject in the Centre or Subject menus, respectively.

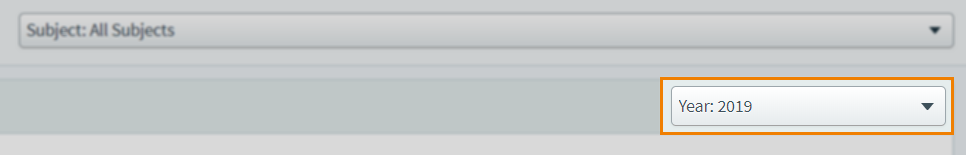
By default, the most recent year is selected. To view data from another year, select the relevant year in the Year menu.
Hover over the chart to view more information about each month’s test volumes.
Exporting Operational Data information as a CSV
To export Operational Data report information to a spreadsheet, select Export as CSV .

Further reading
To learn more about Reporting, read the following articles: