Viewing Items Delivered reports
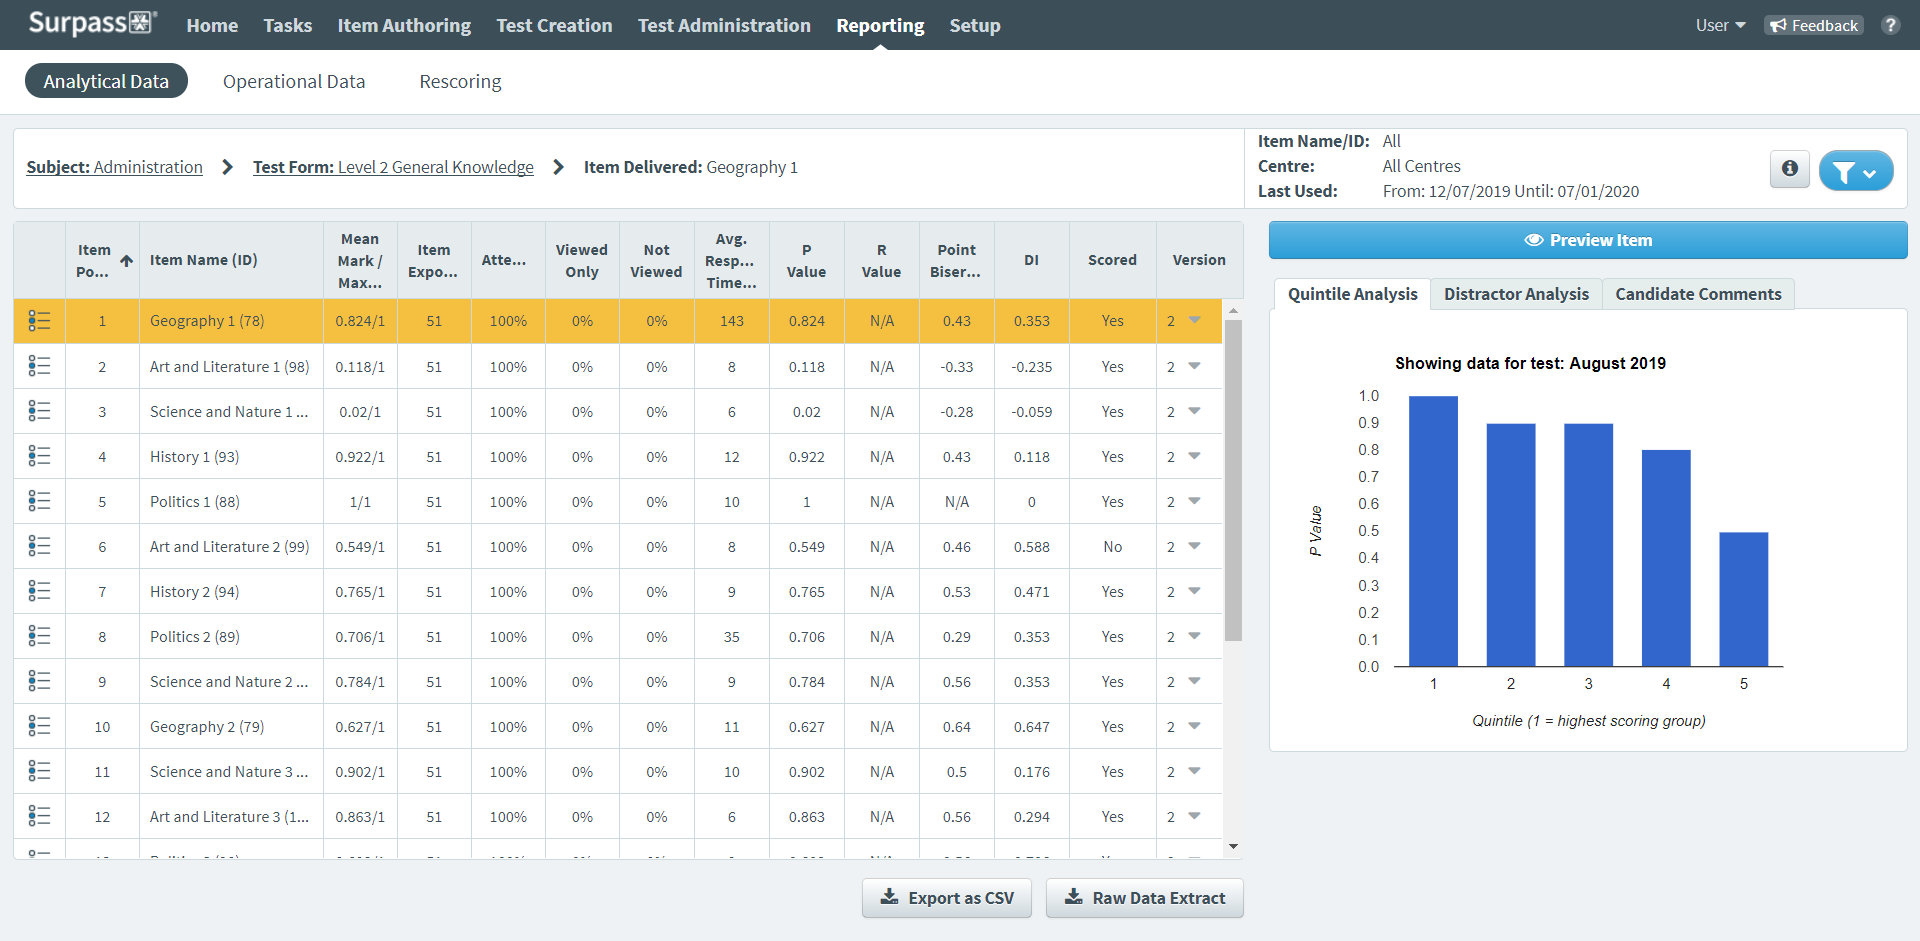
The Items Delivered report in Reporting displays a detailed analysis of how each item has performed in a test form. This includes information like the average mark achieved by candidates, item exposure, P value, R value, and discrimination index.
This article explains how to navigate and interpret and Items Delivered report, including how to perform a raw data extract.
In this article
Navigating to an Items Delivered report
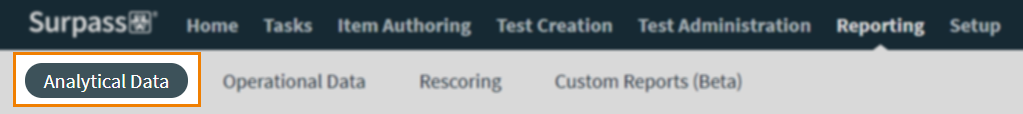
To view an Items Delivered report, go to Reporting > Analytical Data.
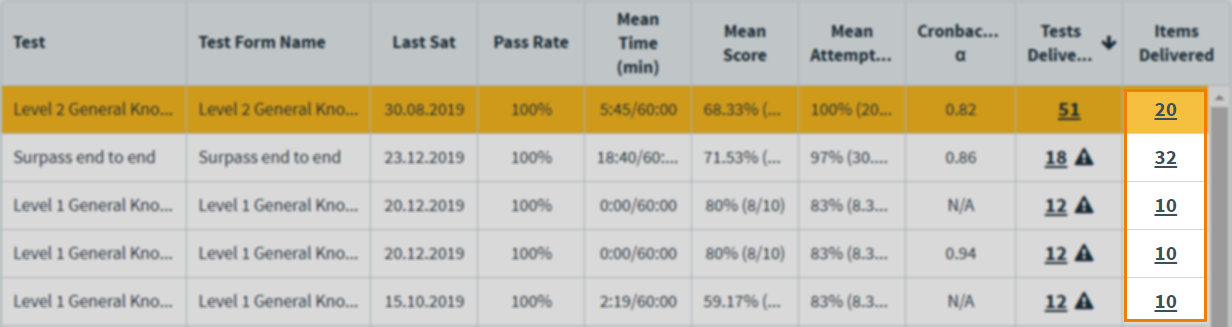
Choose a subject in the Analytical Data screen and select the number in the Test Forms column to view the Test Forms report.

To review how items in a test form performed, select the number in the Items Delivered column.
About the Items Delivered report table
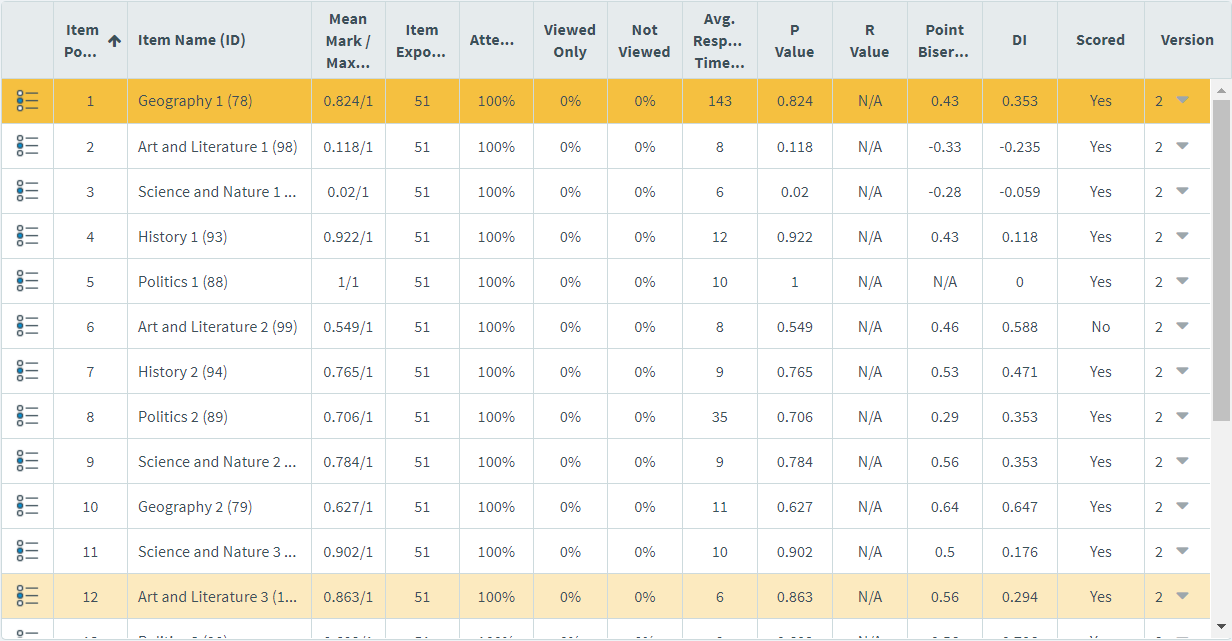
The Items Delivered report grid lists all items in the chosen test form. Each row is dedicated to a single item. Refer to the following table for information on each column.
| Column | Description |
|---|---|
| Item Position in Test |
Displays the item’s position in the test form. This is not applicable if items are randomised or chosen by dynamic rules.
NOTE: By default, the table is sorted by Item Position in Test in ascending order.
|
| Item Name (ID) | Displays the item’s name. The item’s unique ID code is displayed in brackets. |
| Mean Mark / Max Mark Available | Displays the average mark achieved on the item and the item’s maximum possible mark. |
| Item Exposure | Displays the number of times the item has been shown to candidates in a test. |
| Attempted | Indicates how many candidates attempted the item as a percentage. |
| Viewed Only | Indicates how many candidates only viewed the item (and did not attempt a response) as a percentage. |
| Not Viewed | Indicates how many candidates did not see the item as a percentage. |
| Avg. Response Time (Seconds) | Displays candidates’ average response time on the item in seconds. |
| P Value |
Displays the item’s probability value. A P value is a statistical representation of item difficulty calculated by dividing the number of times an item has been answered correctly by the number of times the item has been attempted. P values are represented as a decimal number between 0 and 1. The closer the P value is to 1, the easier the item is considered to be. If an item is answered correctly nine times out of ten, it will have a P value of 0.9. This could be considered an easy item. If an item is answered correctly five times out of ten, it will have a P value of 0.5. This could be considered a medium item. If an item is answered correctly two times out of ten, it will have a P value of 0.2. This could be considered a hard item. |
| R Value |
Displays the item’s R value (also known as the Pearson product moment correlation coefficient). The R value measures the correlation between the item score and the test score. R values range between -1 and +1. A positive R value (0.1 to 1) indicates a positive correlation between candidates’ item scores and test scores. A neutral R value (0) indicates no correlation between candidates’ item scores and test scores. A negative R value (-1 to -0.1) indicates a negative correlation between candidates’ item scores and test scores.
IMPORTANT: R values are only populated for non-dichotomously scored items. Non-dichotomously scored items can have multiple outcomes. Some examples of non-dichotomously scored items would be an Essay item worth ten marks and a Multiple Response item with four correct answer options worth four marks, where one mark is awarded for each correct answer option.
|
| Point Biserial |
Displays the item’s point biserial correlation coefficient. This is a special version of the Pearson R value that only applies to dichotomously scored items. Point biserial values range between -1 and +1. A positive point biserial value (0.1 to 1) indicates a positive correlation between candidates’ item scores and test scores. A neutral point biserial value (0) indicates no correlation between candidates’ item scores and test scores. A negative point biserial value (-1 to -0.1) indicates a negative correlation between candidates’ item scores and test scores.
IMPORTANT: Point biserial values are only populated for dichotomously scored items. Dichotomously scored items only have two outcomes (correct and incorrect). An example of a dichotomously scored item would be a Multiple Choice item worth one mark.
|
| DI |
Displays the item’s discrimination index (DI). A discrimination index indicates the extent to which an item is able to successfully discriminate high-performing candidates from low-performing candidates. If more high-performing candidates get an item right than low-performing candidates, the item positively discriminates and has a DI between 0 and 1. An item with a positive DI generally supports for the assessment qualities of the test. If more low-performing candidates get an item right than high-performing candidates, the item negatively discriminates and has a DI between -1 and 0. An item with a negative DI can compromise the integrity of the test. |
| Scored |
Indicates whether the candidate’s performance on the item contributed to their total mark for the test.
NOTE: You are informed if an item has been used as both a scored and non-scored item in multiple test forms during the specified date range.
|
| Version |
Displays the item’s version number. If multiple item versions have been delivered to candidates, you are able to view each version’s data. By default, the Items Delivered report displays the most recent version. |
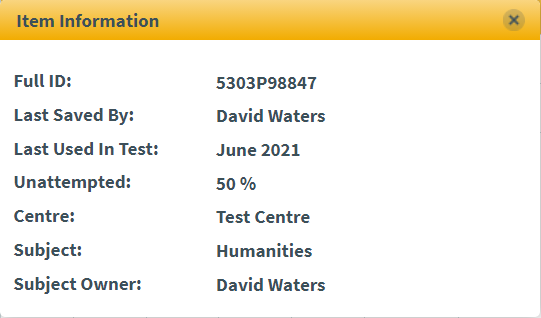
To view more information about an item, choose the subject and select Item Information .

The Item Information dialog displays the selected item’s ID number, who it was last saved by, when it was last used in a test, how often it has been unattempted, its parent centre, subject, and subject owner.
About the Quintile Analysis panel
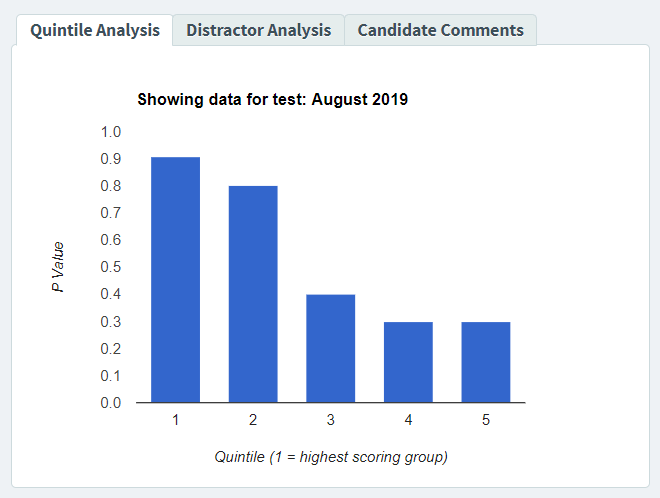
The Quintile Analysis chart divides candidates into five performance brackets known as “quintiles” (quintile 1 being the highest performing bracket and quintile 5 being the lowest). Each quintile is given an average P value. The chart allows you to see the spread of difficulty matched to performance level across the whole candidate pool.
About the Distractor Analysis panel
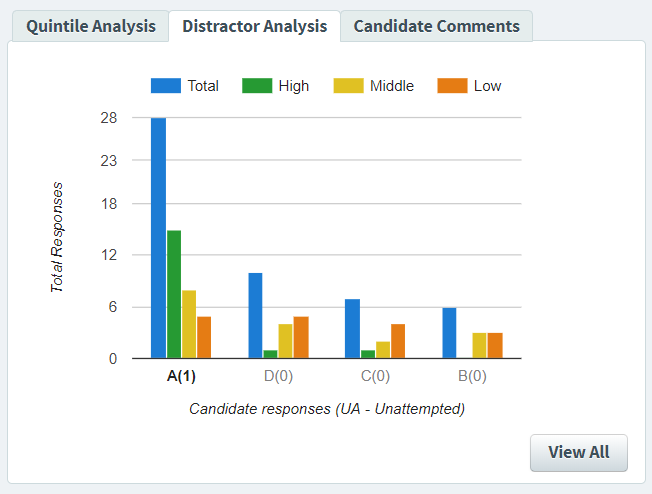
The Distractor Analysis chart displays analytical data for Multiple Choice, Multiple Response, and Either/Or answer options. Candidates are divided into three performance groups (High, Middle, and Low), with each group’s responses charted against the relevant answer option.
About the Candidate Comments panel
If candidate comments have been enabled on the test form, you can view any comments candidates have left on items in the Candidate Comments panel along with the candidate’s name and reference.
Select Export as CSV to download all candidates’ comments in spreadsheet format.
Filtering the Items Delivered report table

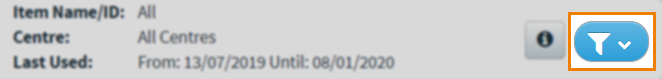
By default, the Items Delivered report displays data from all items used in the test form in the last 30 days. To change the data range, select Filter .
To learn more about the available filters, refer to the following table.
| Filter | Description |
|---|---|
| Last Used | Determines the date range for the Items Delivered report. Choose whether the grid displays data for items used in the Last 7 Days, Last 30 Days (default), Last 180 Days, or a Custom Date Range. |
| Hide items where fewer than 50 tests taken |
Only shows items that have been used at least 50 times.
NOTE: Psychometric statistics may not be reliable for items that have been used less than 50 times.
|
| Scored Items | Displays scored items on the Items Delivered report. |
| Non-scored Items | Displays non-scored items on the Items Delivered report. |
| Item Name or ID | Finds items based on their names or ID numbers. |
Exporting Items Delivered reports
You can export two reports from the Items Delivered screen.
Exporting a report as a CSV
To export the data in the Items Delivered report table to a spreadsheet, select Export as CSV .

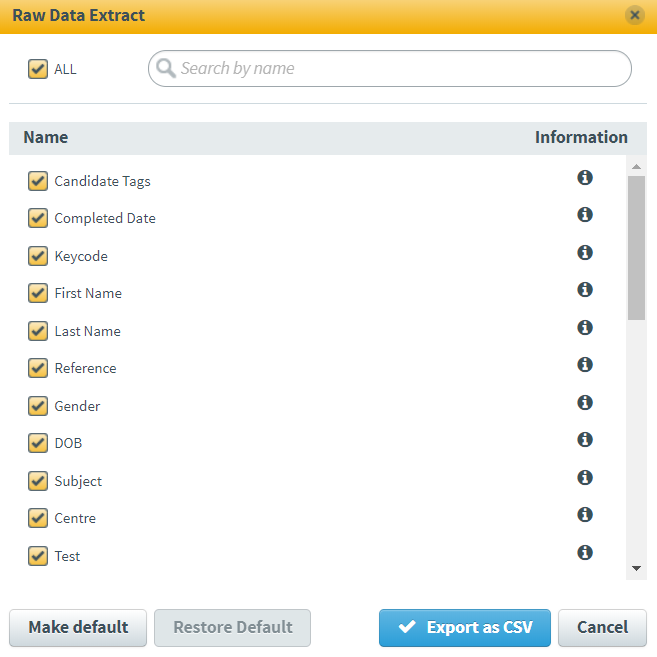
Raw Data Extract
To export all available information attached to the items (including data not in the Items Delivered table such as tags, item relationships, and each candidates’ response), select Raw Data Extract .

Select the information you want to include in the Raw Data Extract dialog. Select or clear ALL to include or remove all options, respectively. Select Export as CSV to download the raw data spreadsheet.
Further reading
To learn more about Reporting, read the following articles: