Viewing Test Forms reports
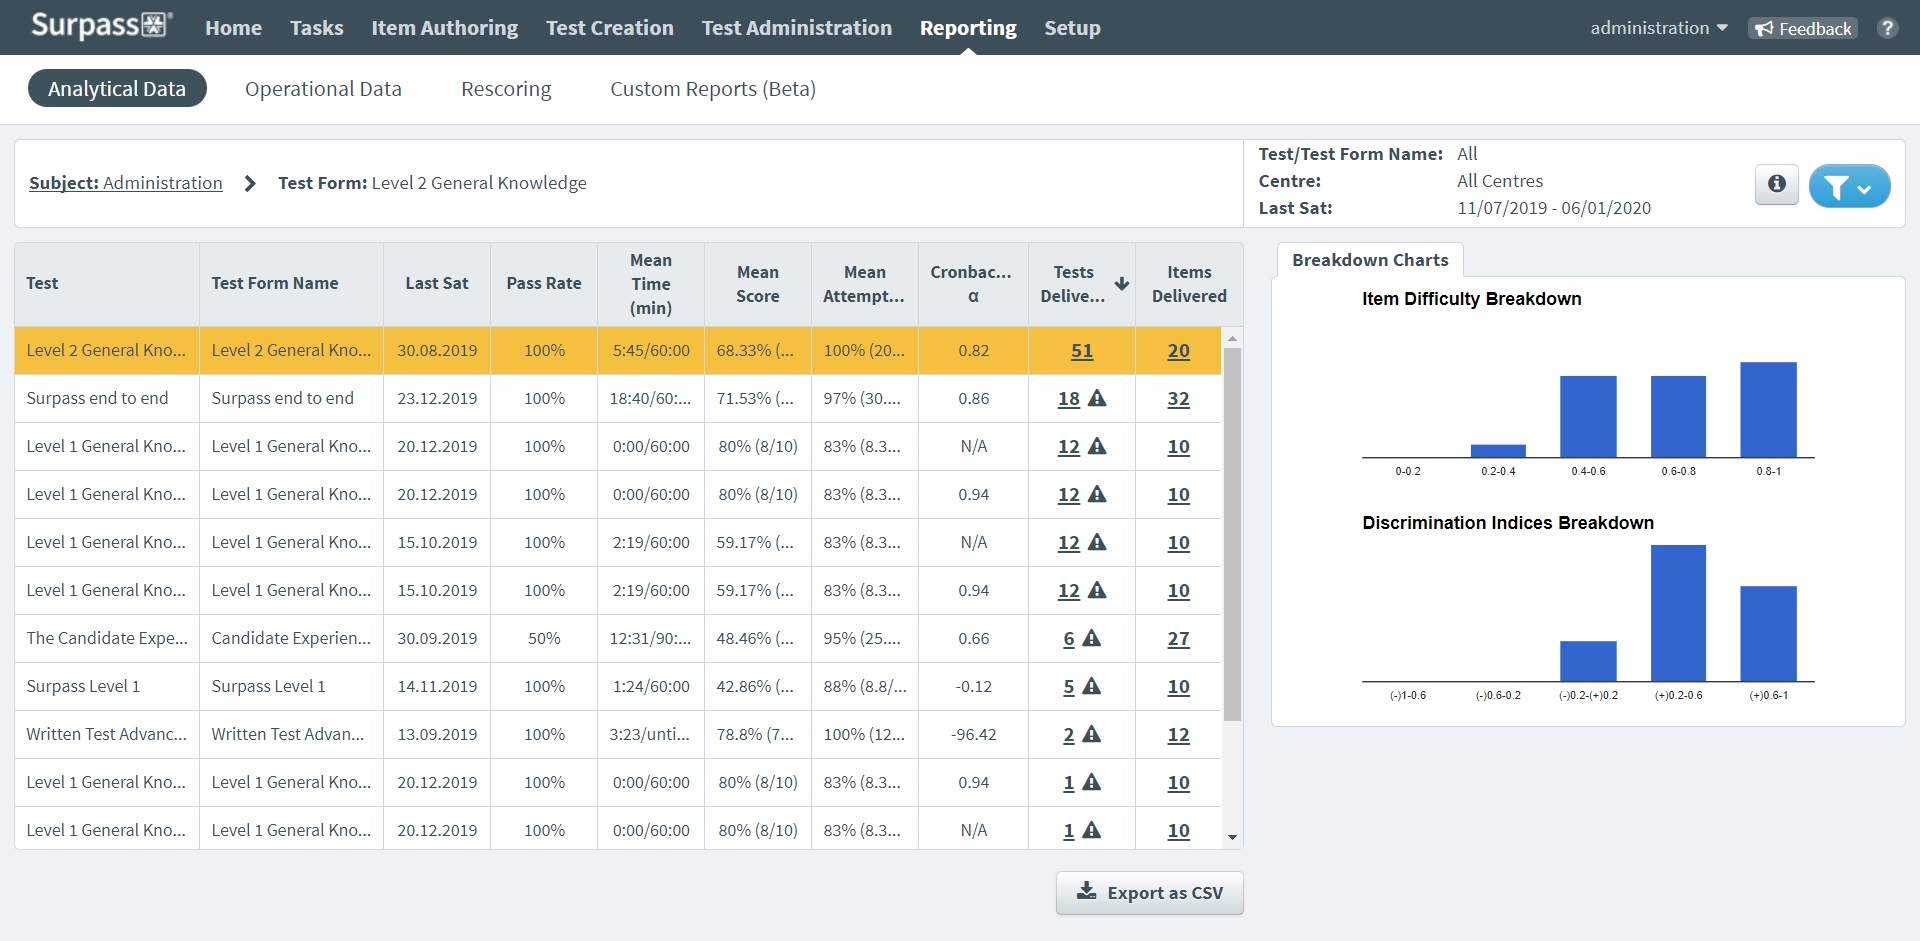
The Test Forms report in Reporting displays how candidates performed on your chosen subject’s test forms. This includes information like test forms’ pass rates, average lengths, and average scores. Also included are breakdowns of each test form’s difficulty and efficacy.
This article explains how to navigate and interpret a Test Forms report, including filtering, exporting reports as a CSV, and viewing more detailed Tests Delivered and Items Delivered reports.
In this article
Navigating to a Test Forms report
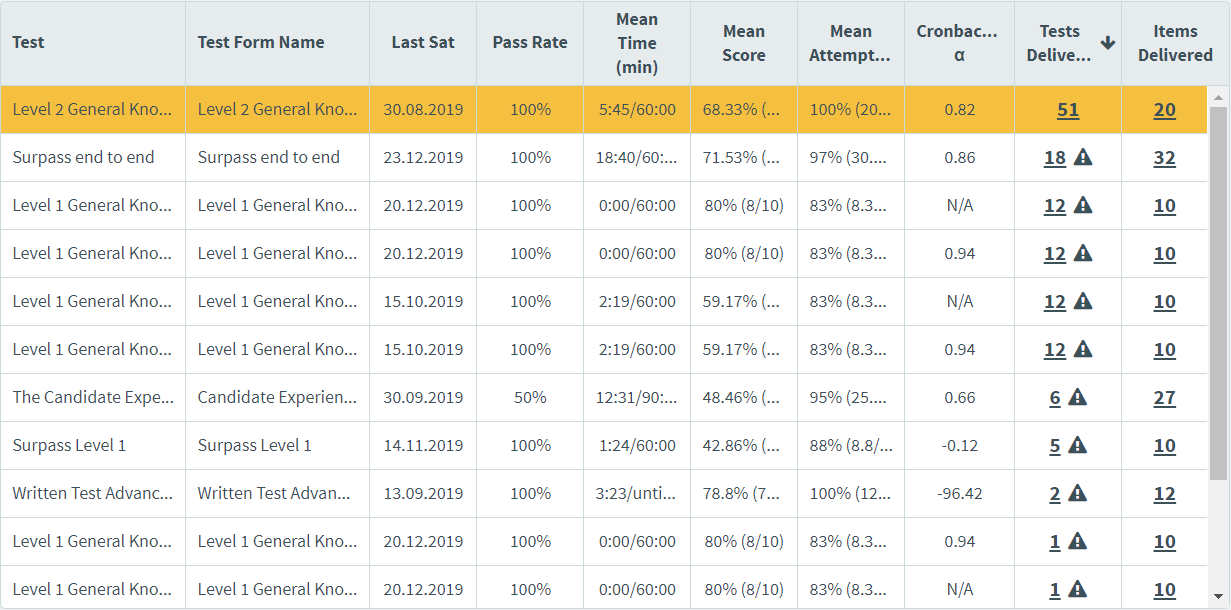
To view a Test Forms report, go to Reporting > Analytical Data.
Choose a subject in the Analytical Data screen and select the number in the Test Forms column to view the Test Forms report.

About the Test Forms report table
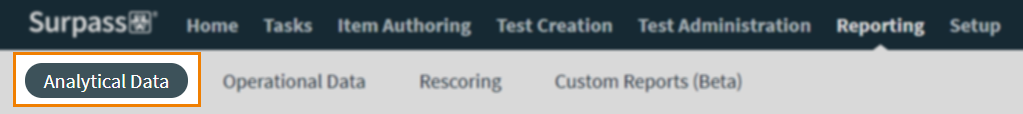
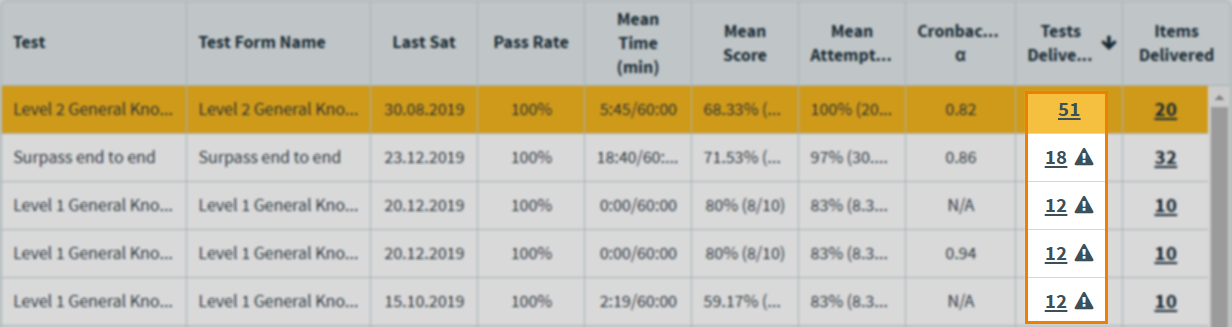
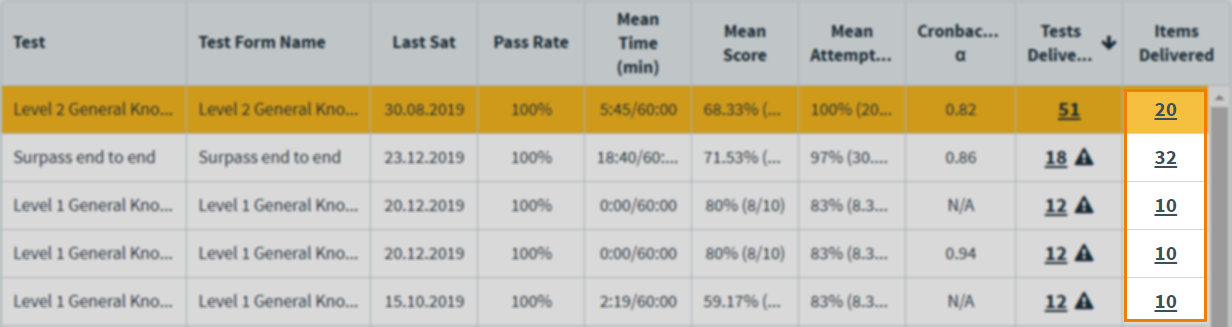
The Test Forms report grid lists all tests forms in your chosen subject. Each row is dedicated to a single test form. Refer to the following table for information on each column.
| Column | Description |
|---|---|
| Test | Displays the name of the test form’s parent test. |
| Test Form Name | Displays the name of the test form. |
| Last Sat | Displays the date on which the test form was last taken by a candidate. |
| Pass Rate | Expresses how many candidates have passed the test form as a percentage. |
| Mean Time (min) |
Indicates the average time (in minutes) it took candidates to submit the test against the total allowed test time.
NOTE: Candidates' test time is still measured for untimed tests.
|
| Mean Score | Expresses the average score achieved by all candidates as a percentage. The raw average score is also displayed against the total available marks in brackets. |
| Mean Attempted | Expresses the average number of items attempted by all candidates as a percentage. The raw average number of attempted items is also displayed against the total number of items in brackets. |
| Cronbach’s α | Expresses the estimated reliability of the test form. Cronbach’s α can take any value less than or equal to 1, including negative values. The closer Cronbach’s α is to 1, the more reliable the test form is estimated to be. |
| Tests Delivered |
Displays the number of tests delivered to candidates. Select the number to view the Tests Delivered report. For more information, read Viewing Tests Delivered reports. |
| Items Delivered |
Displays the number of items in the test form that have been delivered to candidates. Select the number to view the Items Delivered report. For more information, read Viewing Items Delivered reports. |
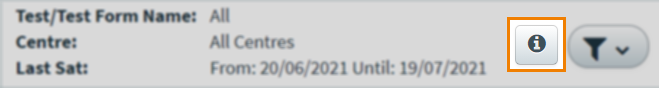
To view more information about a test form, choose the test form and select Test Information .
Refer to the following table for information about each field in the Test Information dialog.
| Field | Description |
|---|---|
| Test Form Reference | Displays the selected test form’s unique alphanumeric reference code. |
| Centre |
Displays the centre the selected test form belongs to. |
| Subject |
Displays the parent subject of the selected test form. |
| Subject Owner |
Displays the subject owner for the parent subject of the selected test form. |
| Standard Deviation |
Displays the standard deviation value for the selected test form. Standard deviation measures the average difference between candidates’ marks and the average mark for all candidates. A low standard deviation value indicates a clustering of results around the average score, and a high value indicates that there is a greater spread between results.
EXAMPLE: If a test form has 10 available marks and both candidates that sat the test scored 8 marks, the standard deviation would be 0 because neither candidate deviated from the average score (8 marks). However, if one candidate scored 0 marks and the other 10, the average mark would be 5 and the standard deviation would also be 5 because the difference between both candidates’ scores (0 and 10) and the average score (5 marks) is 5.
|
| SEM |
Displays the standard error of measurement (SEM) value for the selected test form. SEM measures how much the variability of results is down to the unsuitability of the test form. It is related to Cronbach’s α; a high Cronbach’s α value would lead to a low SEM, and vice versa. |
About the breakdown charts
Depending on whether enough data has been gathered from candidates, each test form might have statistical data represented in two bar charts.
Item Difficulty Breakdown
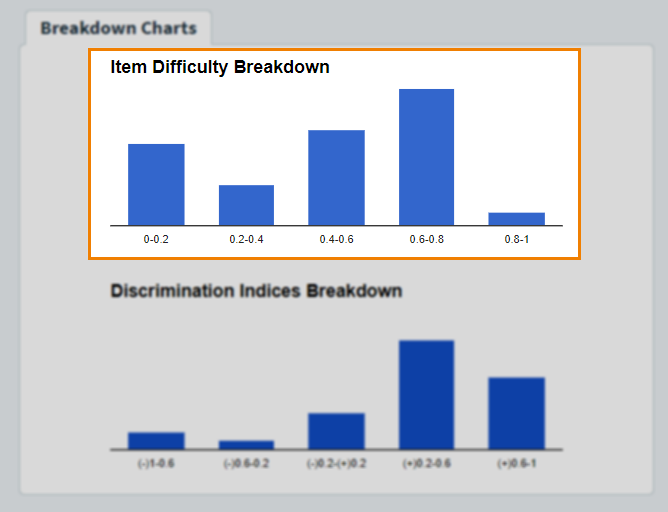
The Item Difficulty Breakdown graph displays the P values of the items in the test form divided into five brackets: 0-0.2 (very difficult), 0.2-0.4 (difficult), 0.4-0.6 (medium), 0.6-0.8 (easy), 0.8-1.0 (very easy).
Discrimination Indices Breakdown
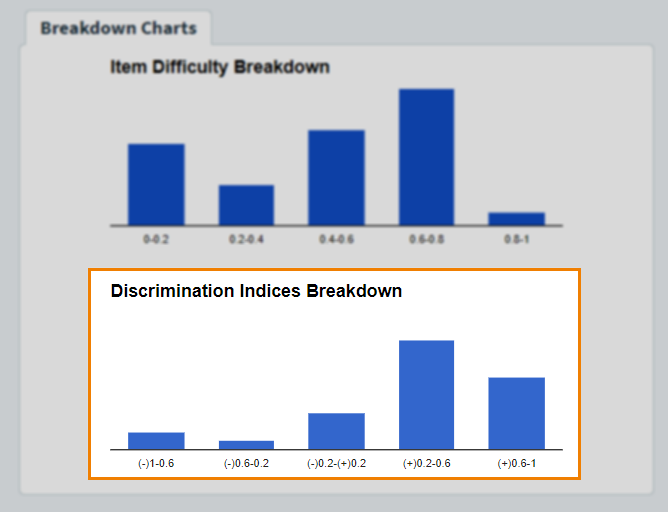
The Discrimination Indices Breakdown graph displays the discrimination indices of the items in the test form divided into five brackets: (-)1-0.6 (very ineffective), (-)0.6-0.2 (ineffective), (-)0.2-(+)0.2 (neither ineffective nor effective), (+)0.2-0.6 (effective), and (+)0.6-1 (very effective).
Filtering the Test Forms report table

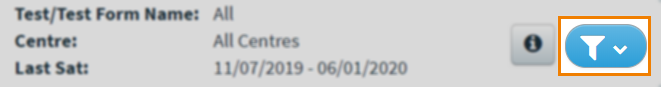
By default, the Test Forms report displays all data from test forms sat in the last 30 days. To change the data range, select Filter .
To learn more about the available filters, refer to the following table.
| Option | Description |
|---|---|
| Last Sat | Determines the date range for the Test Forms report. Choose whether the grid displays data for test forms sat in the Last 7 Days, Last 30 Days (default), Last 180 Days, or a Custom Date Range. |
| Hide tests where fewer than 50 taken |
Only shows test forms that have been sat by candidates at least 50 times.
NOTE: Psychometric statistics may not be reliable for test forms that have been sat less than 50 times.
|
| Test Name or Test Form name |
Finds tests or test forms based on their names. |
To reset the filters to their default values, select Clear.
Exporting a Test Forms report as a CSV
To export Test Forms report data to a spreadsheet, select Export as CSV .

Viewing more detailed reports
You can view more in-depth reports from the Test Forms report table.
Tests Delivered reports
To view a detailed report on each candidate’s performance on a test form, select the number in the Tests Delivered column. For more information, read Viewing Tests Delivered reports.
Items Delivered reports
To review how items in a test form performed (including information like individual P values, R values, and discrimination indices), select the number in the Items Delivered column. For more information, read Viewing Items Delivered reports.
Further reading
To learn more about Reporting, read the following articles: